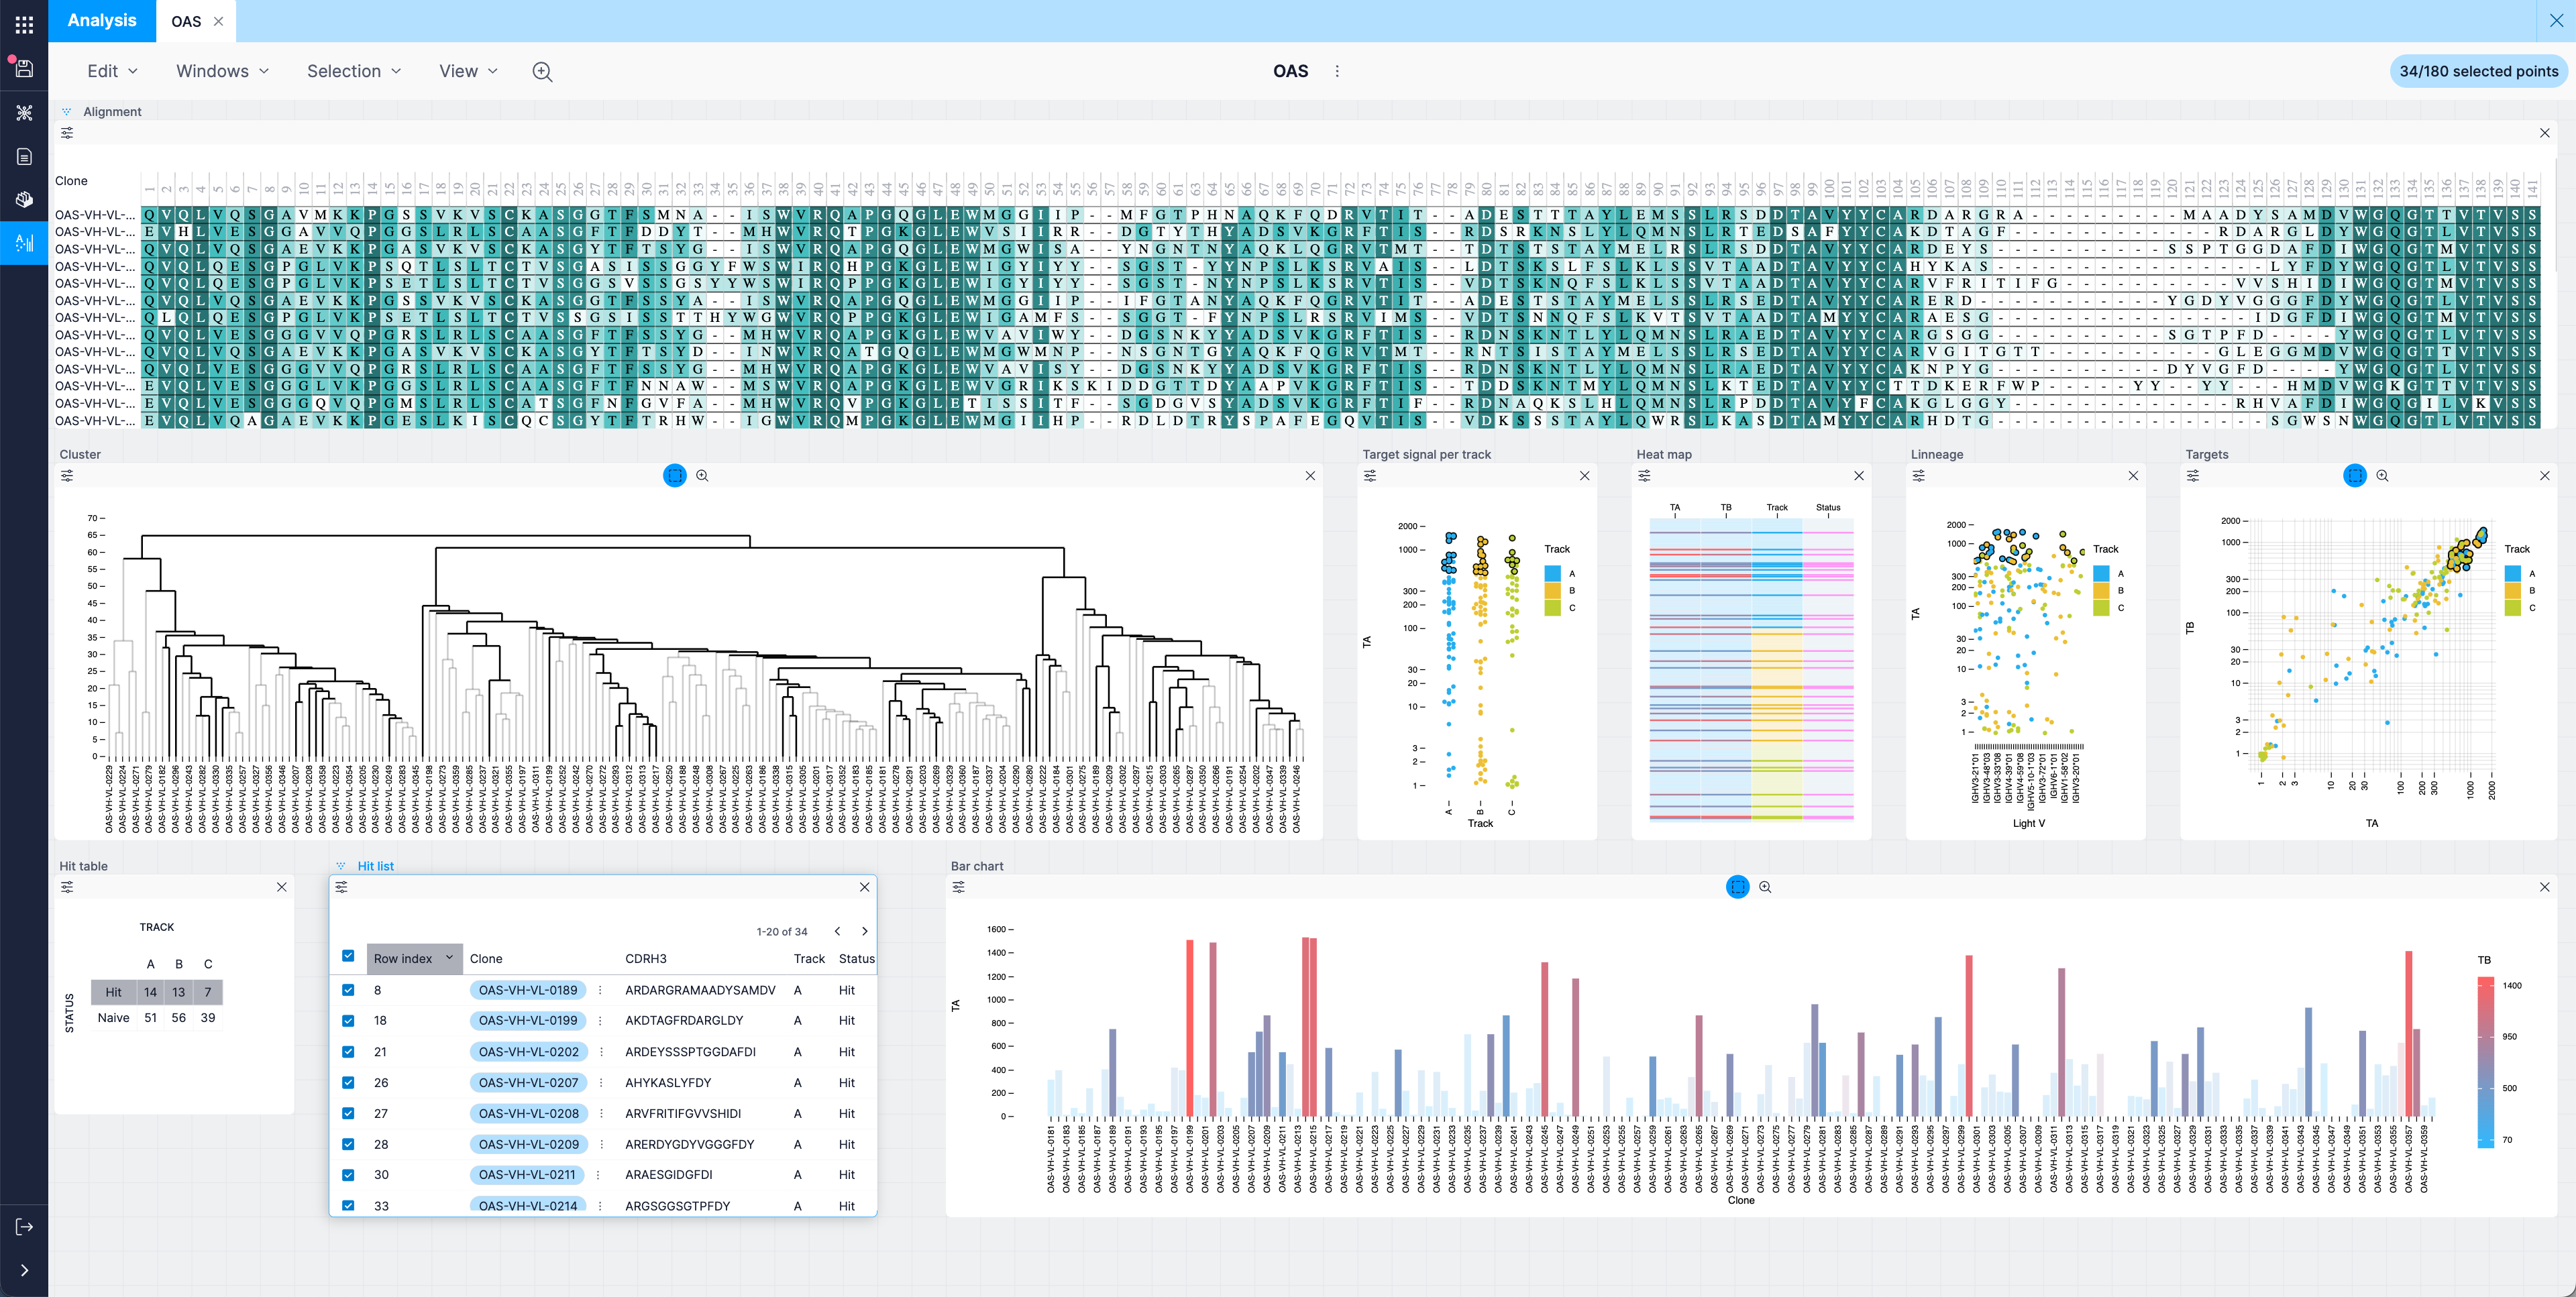
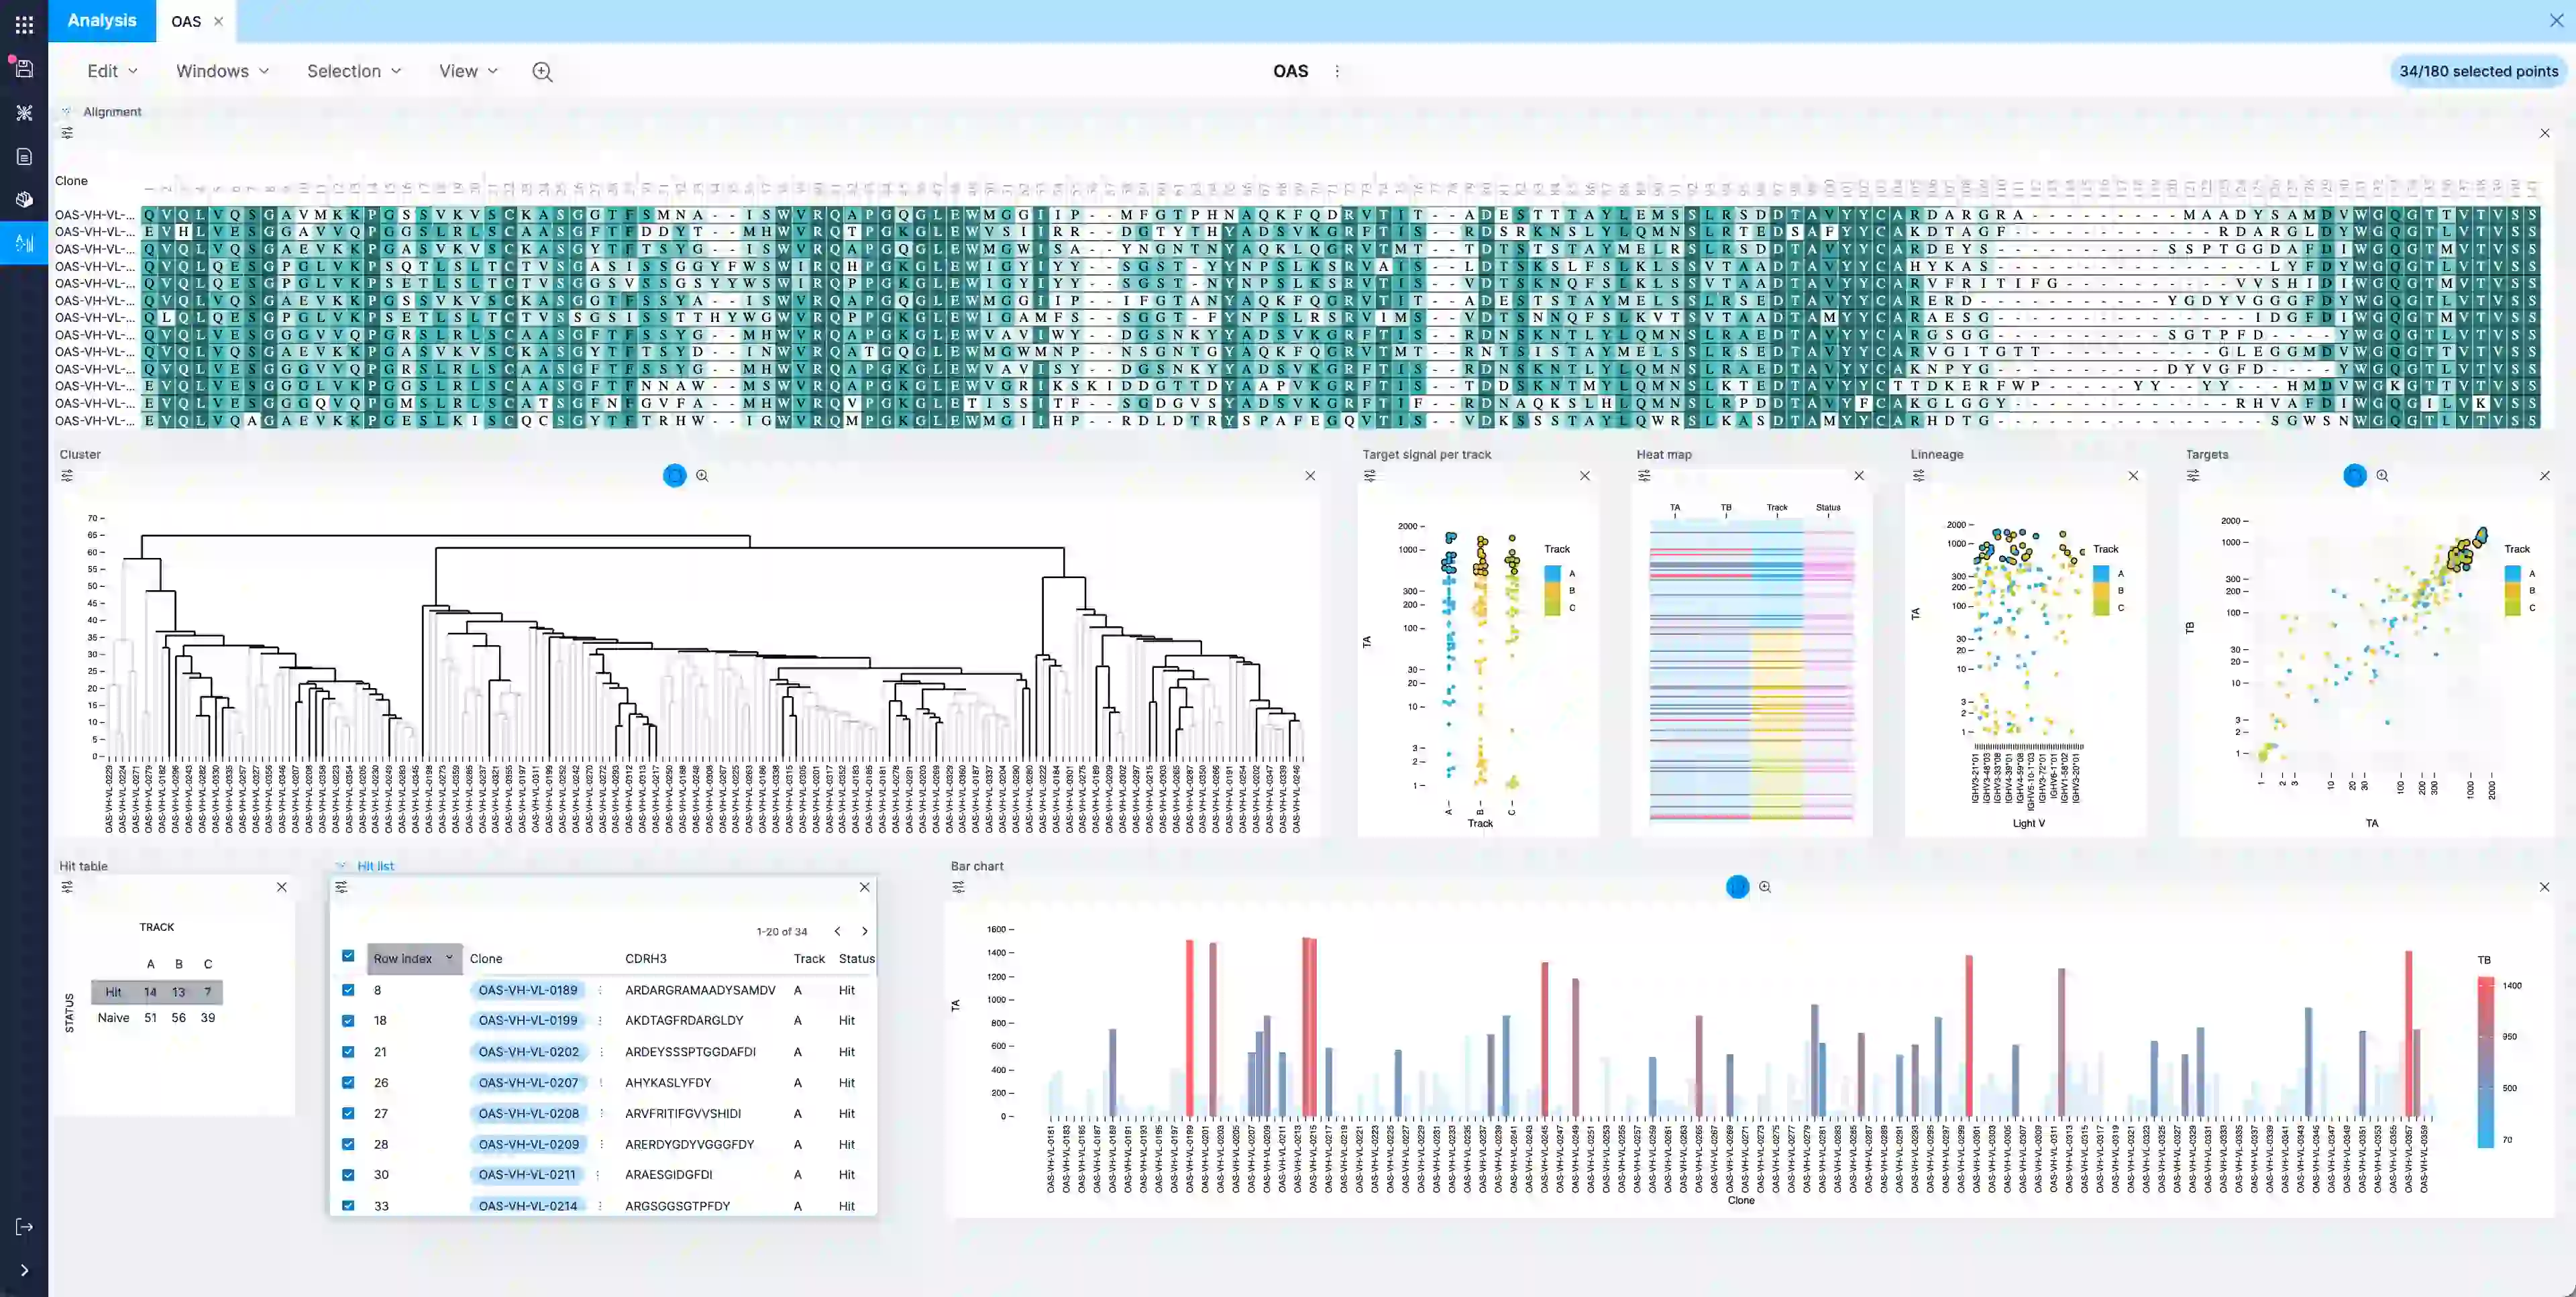
An analysis is performed on a canvas with windows. This screenshot shows an alignment of
sequences, a hierarchical clustering of sequences, a chart of signals grouped by some other
property, a heat map, another chart with groups and colors, a dot chart, a contingency table,
a list of clones, and a bar chart of the clones.
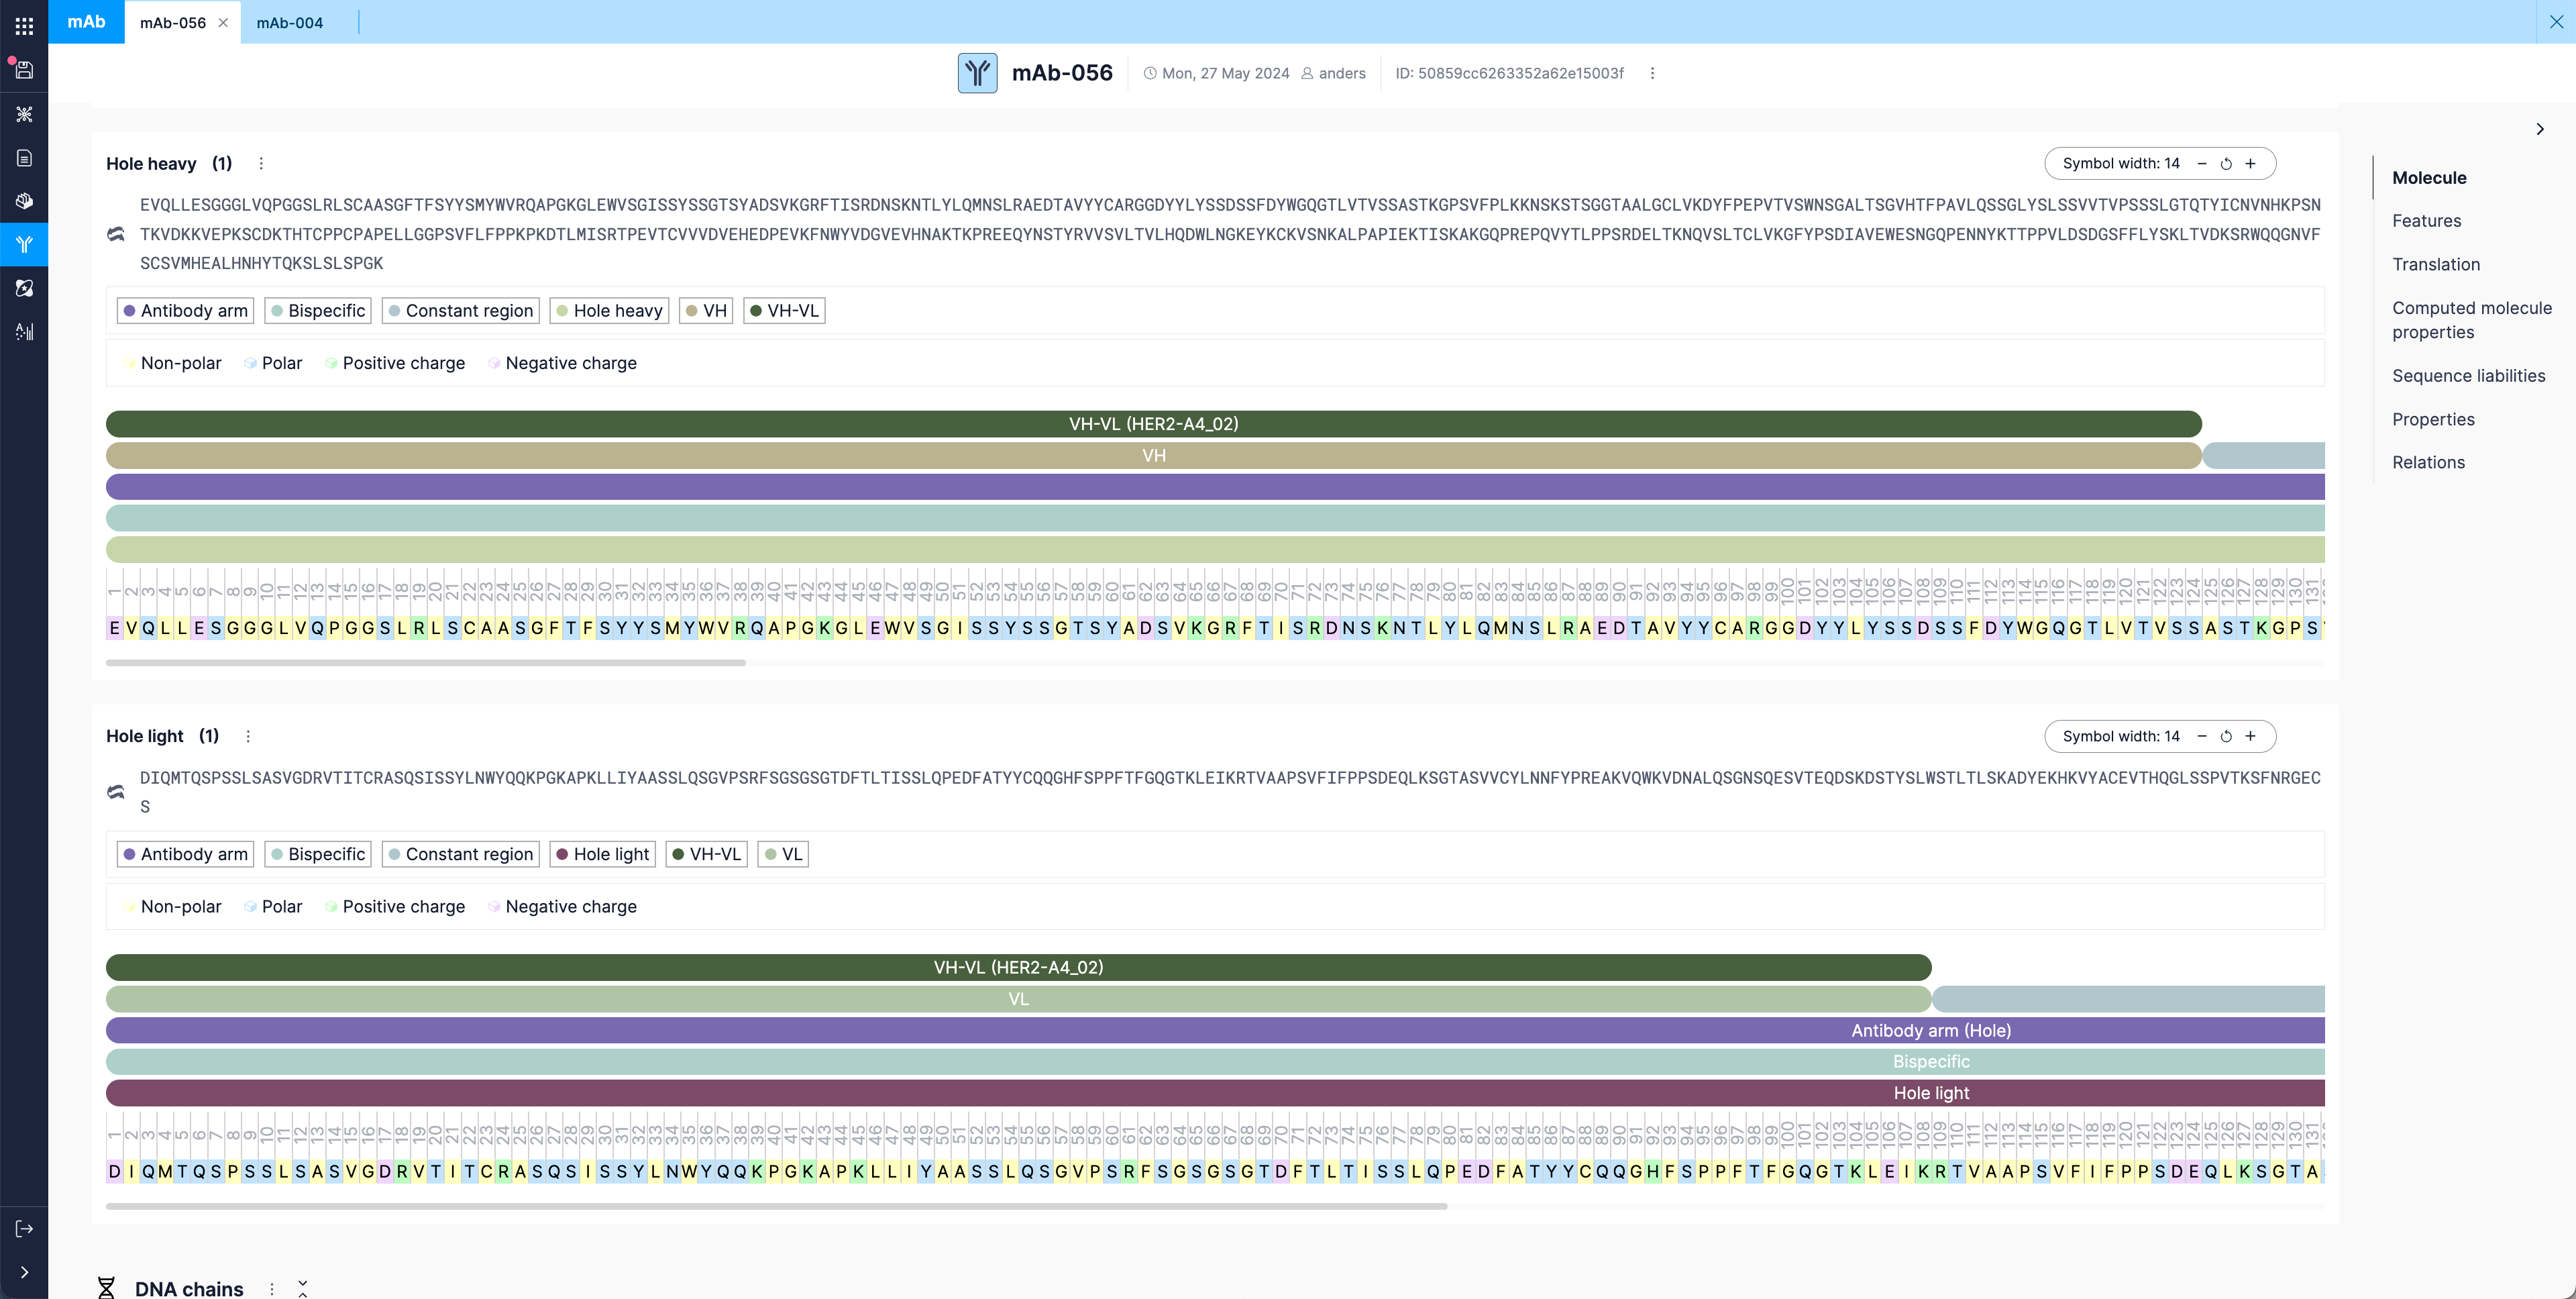
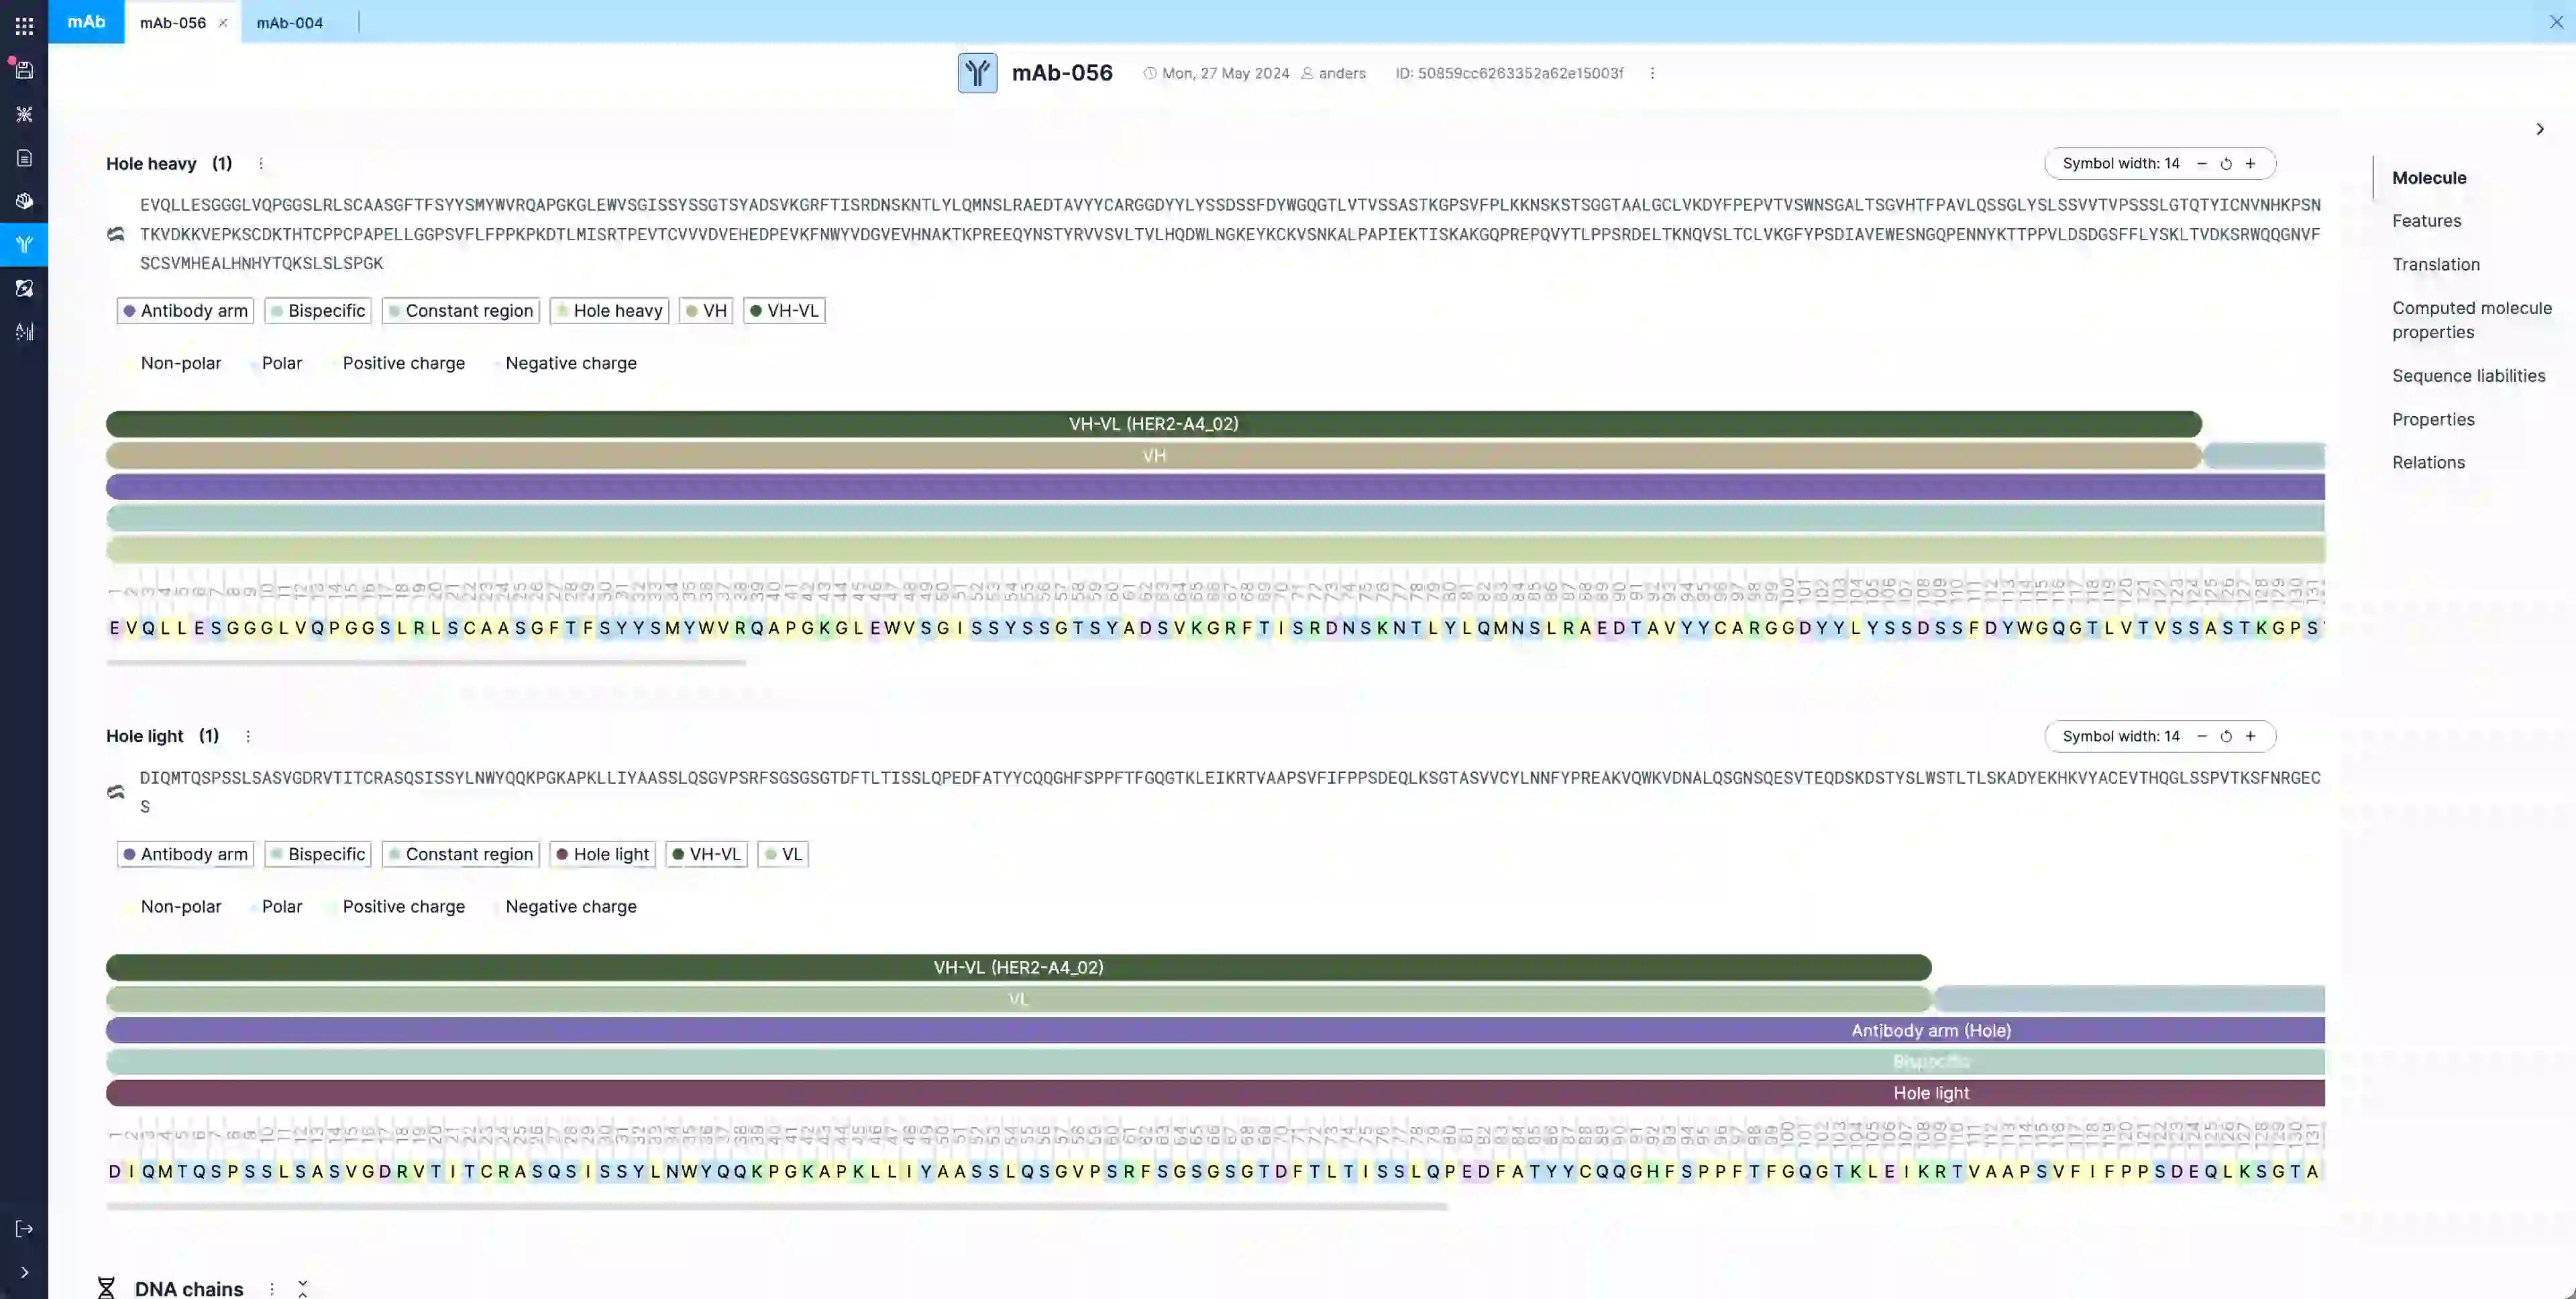
A molecule page show the chains of the molecule. In this case, a heavy and light chain are shown.
The chains have features at particular ranges such as constant region, Hole heavy, VH, VH-VL.
Features are used to keep track of interesting sub-sequences. Molecules can have both DNA and protein
chains. Physical properties such as molecular weight and iso-electric points can be calculated.
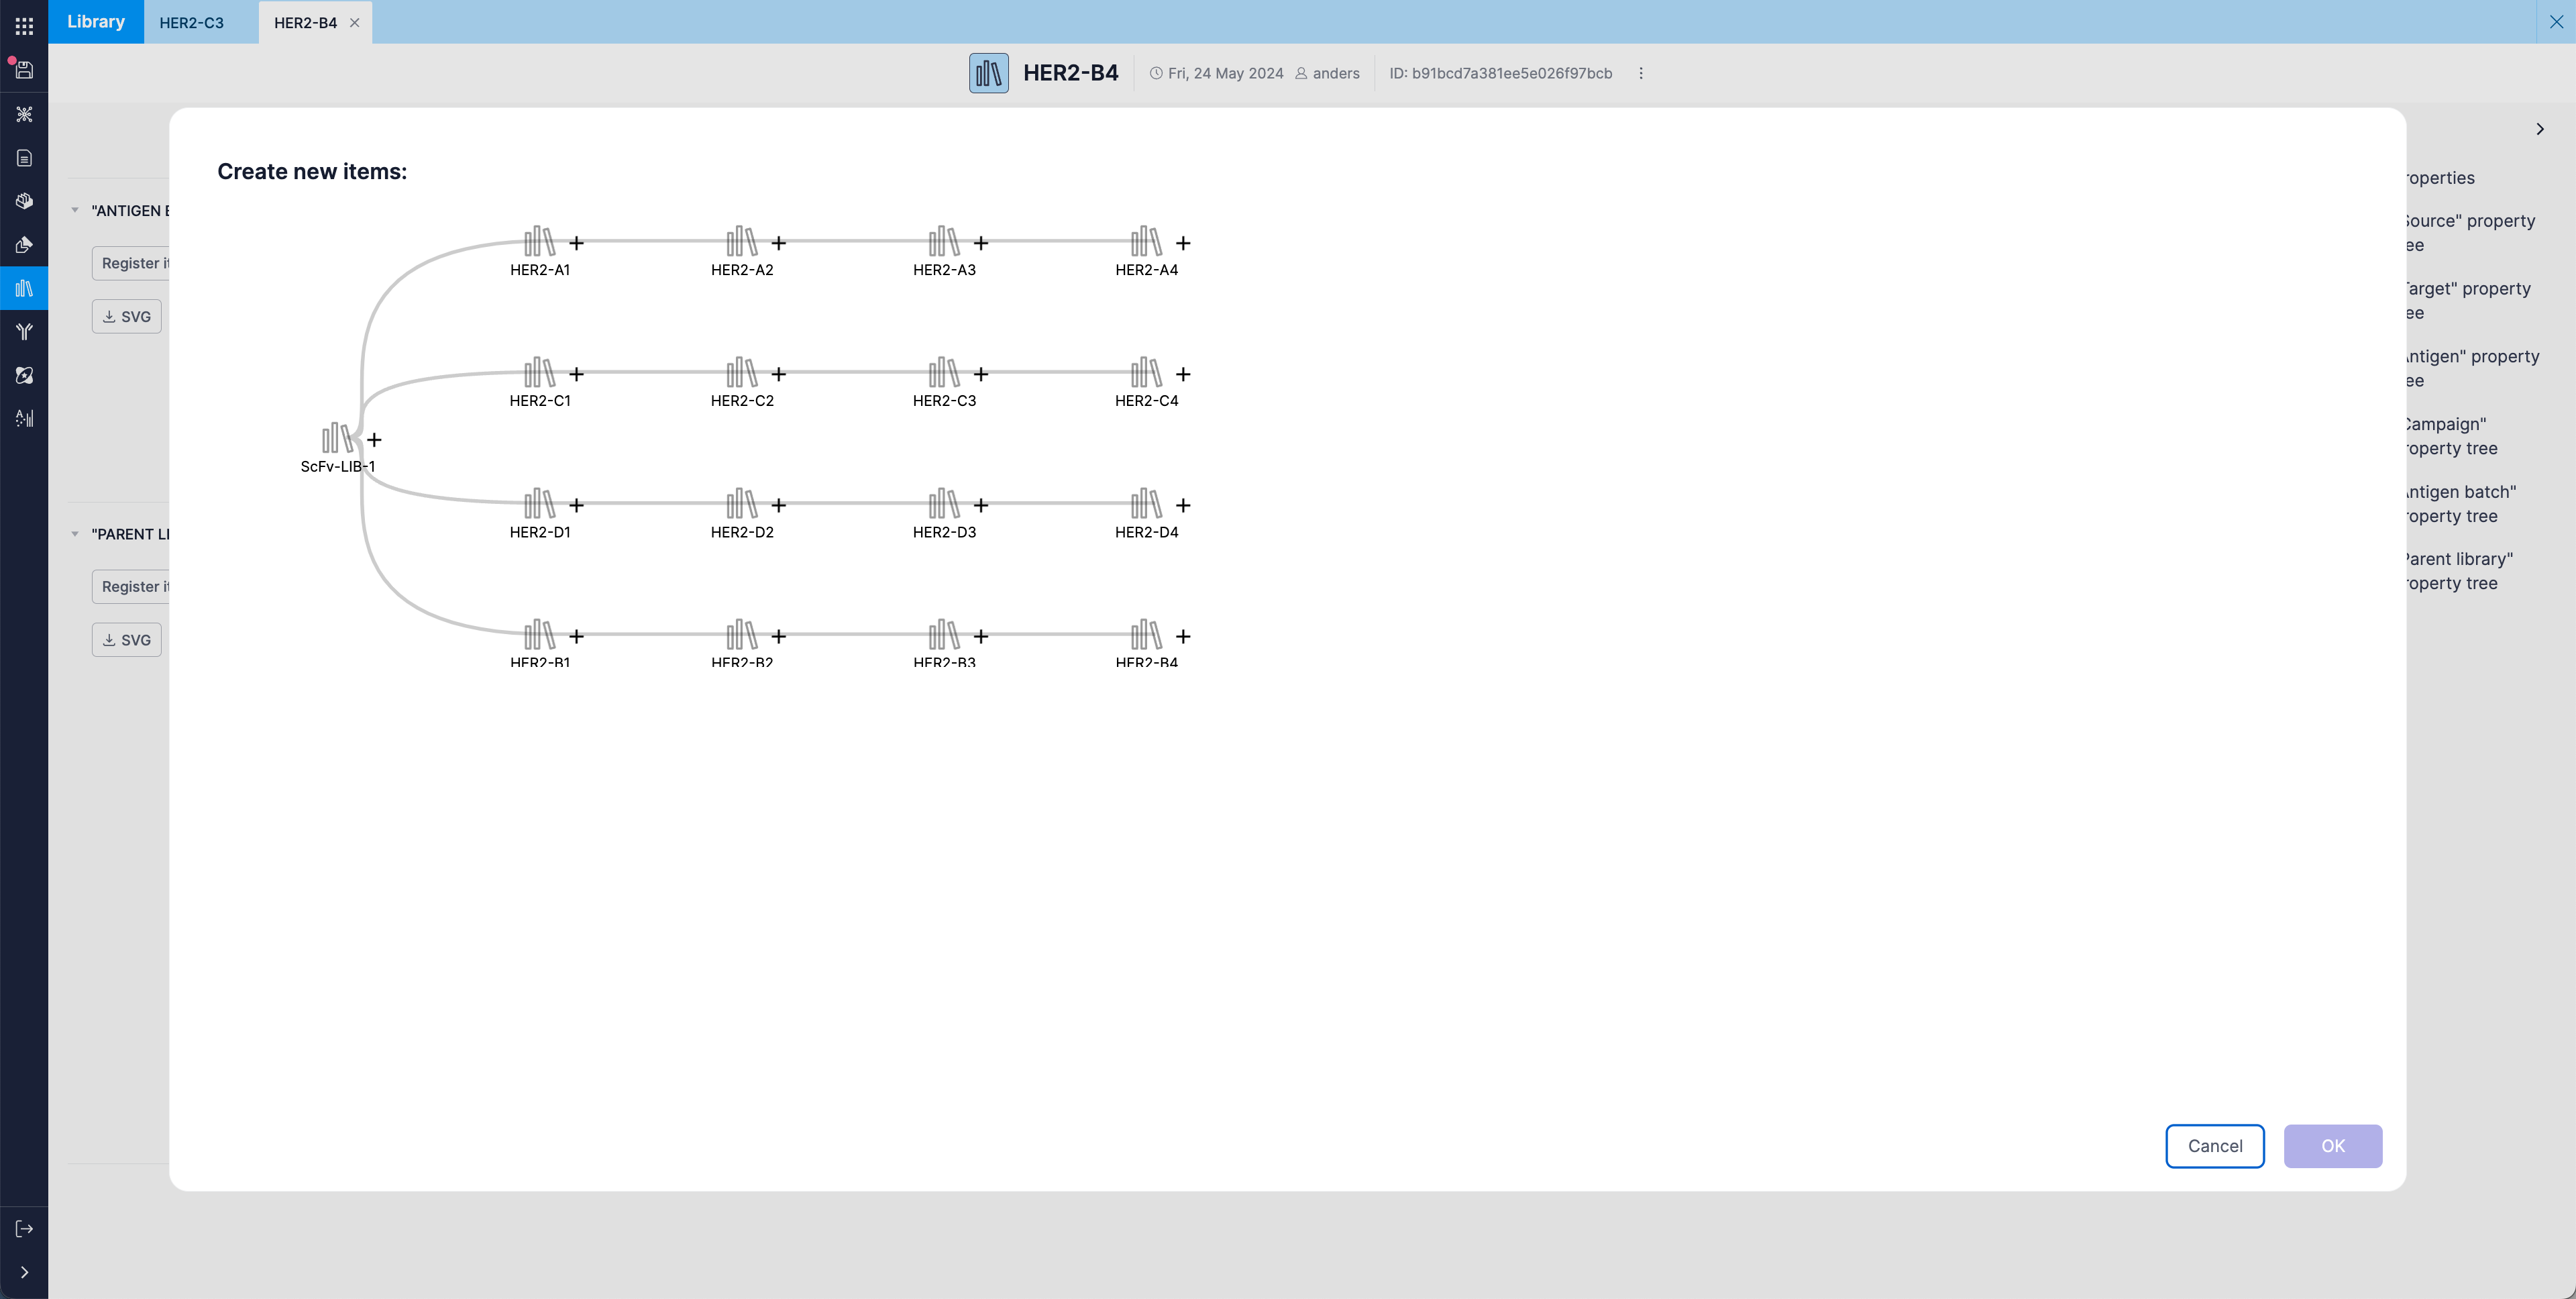
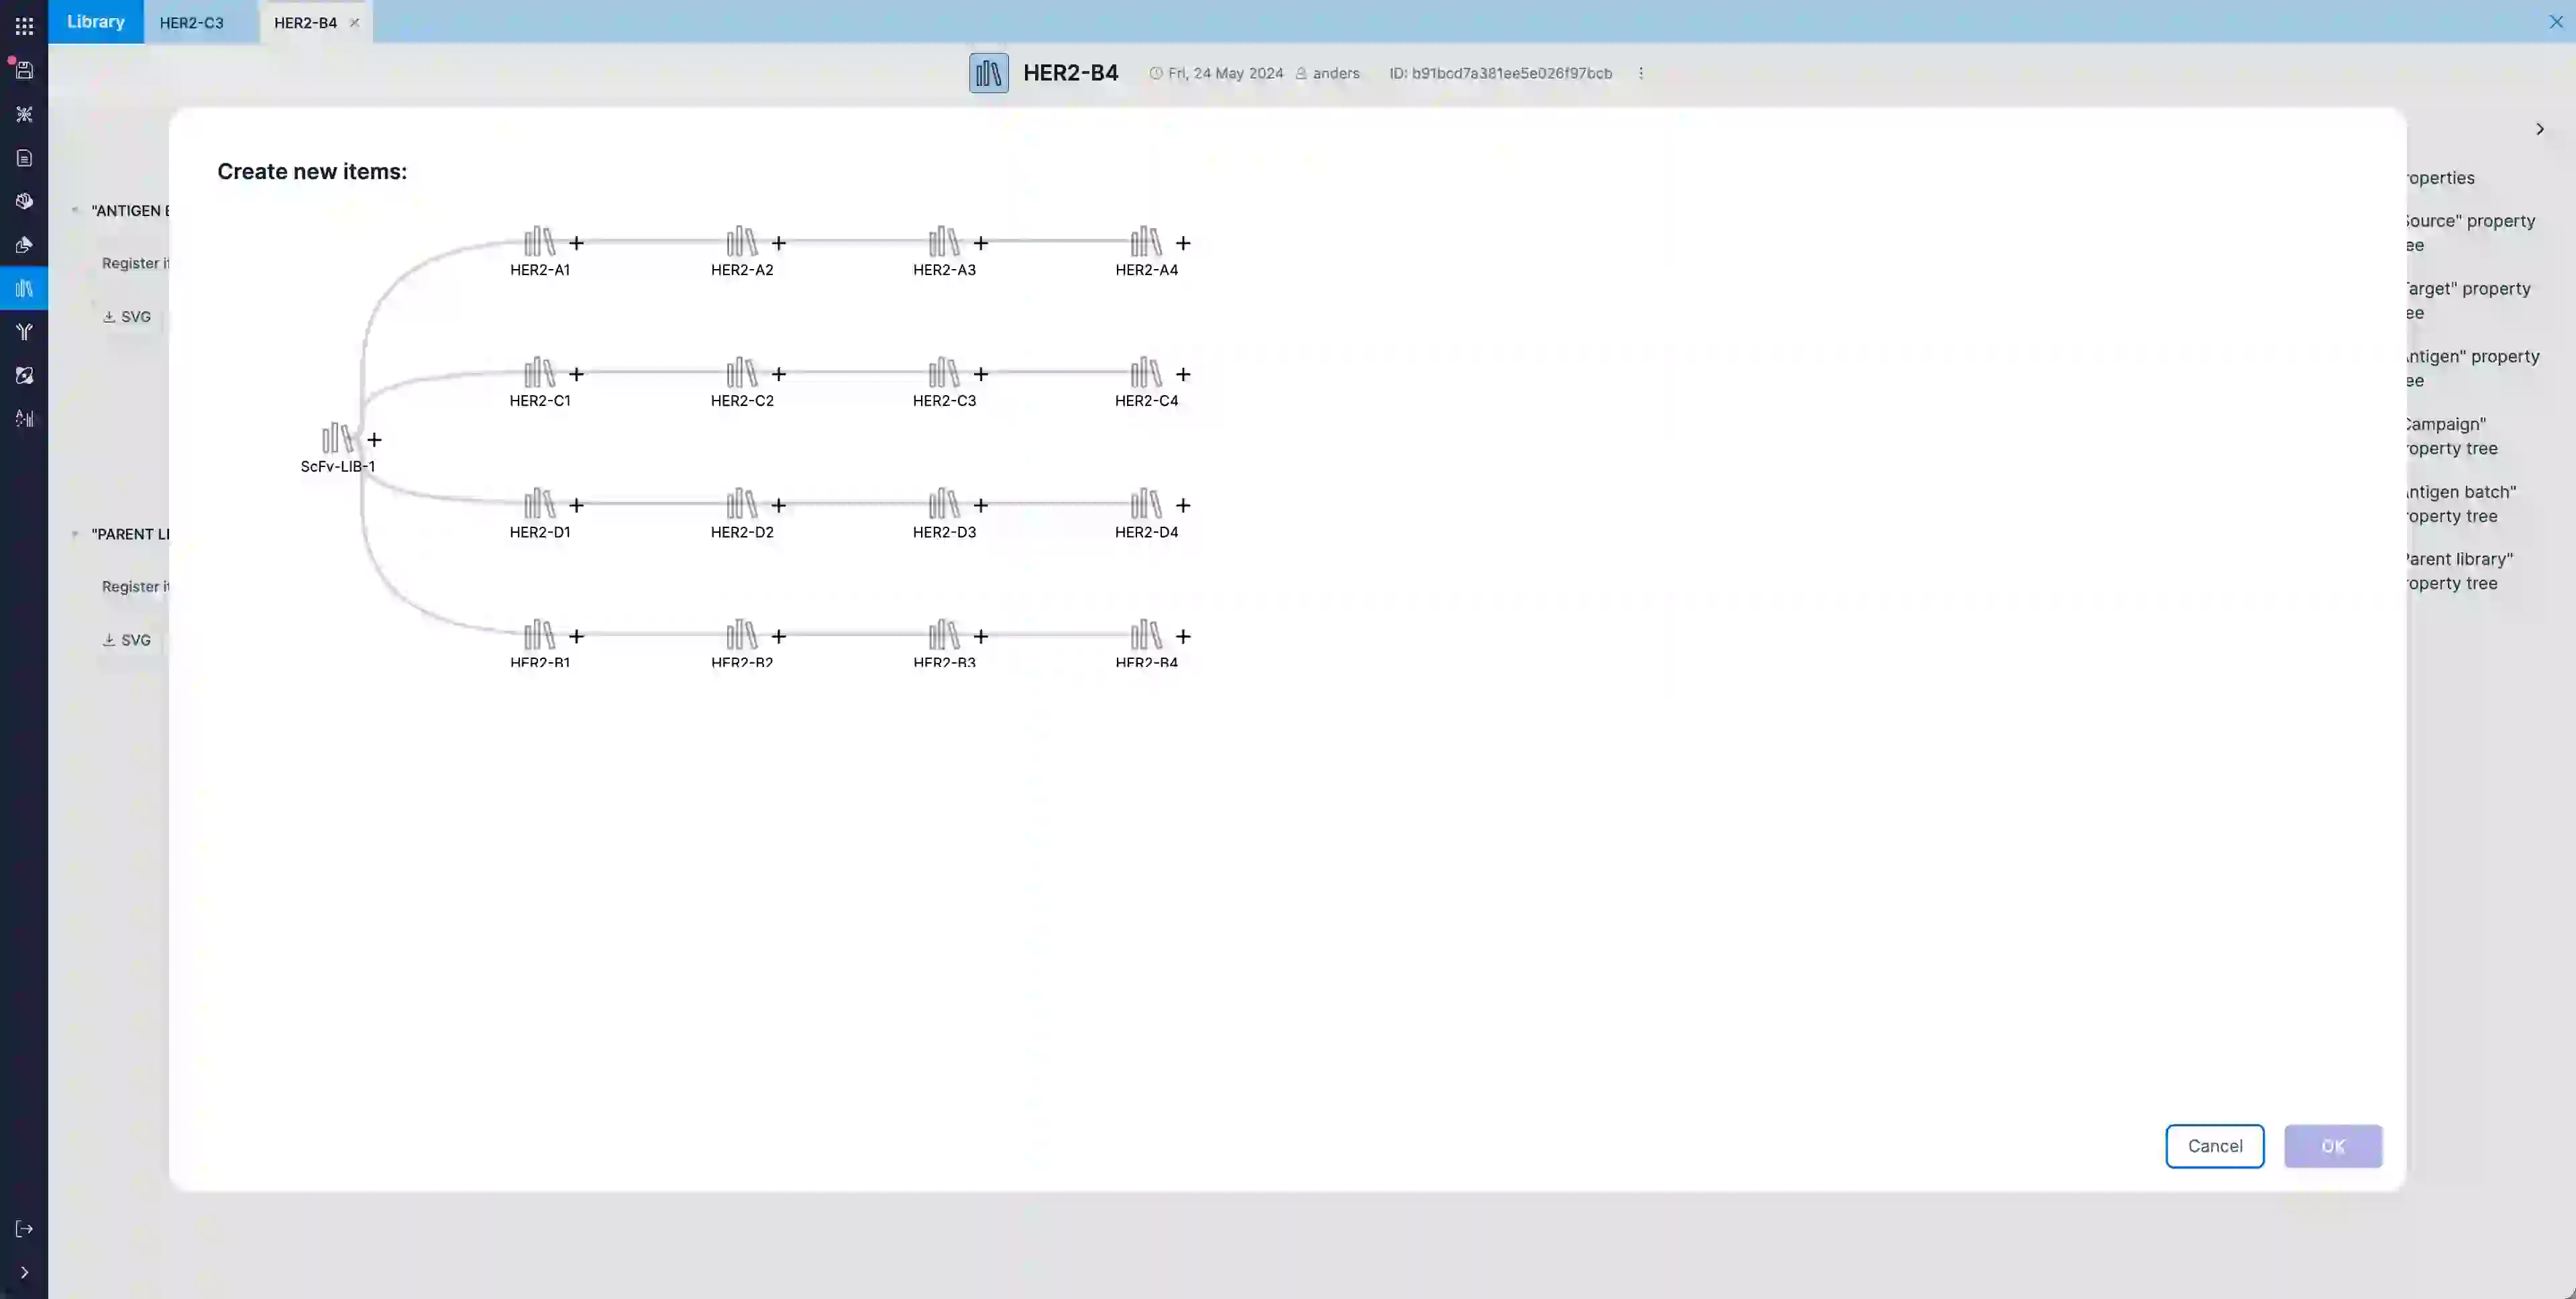
A tree of pannings of a library is shown in a modal on top of the page. New pannings can be created.
The original library is shown as the root of the tree. Several rounds of pannings are added. The Bionamic
application keeps track of the pannings and sequences can refer back to pannings.
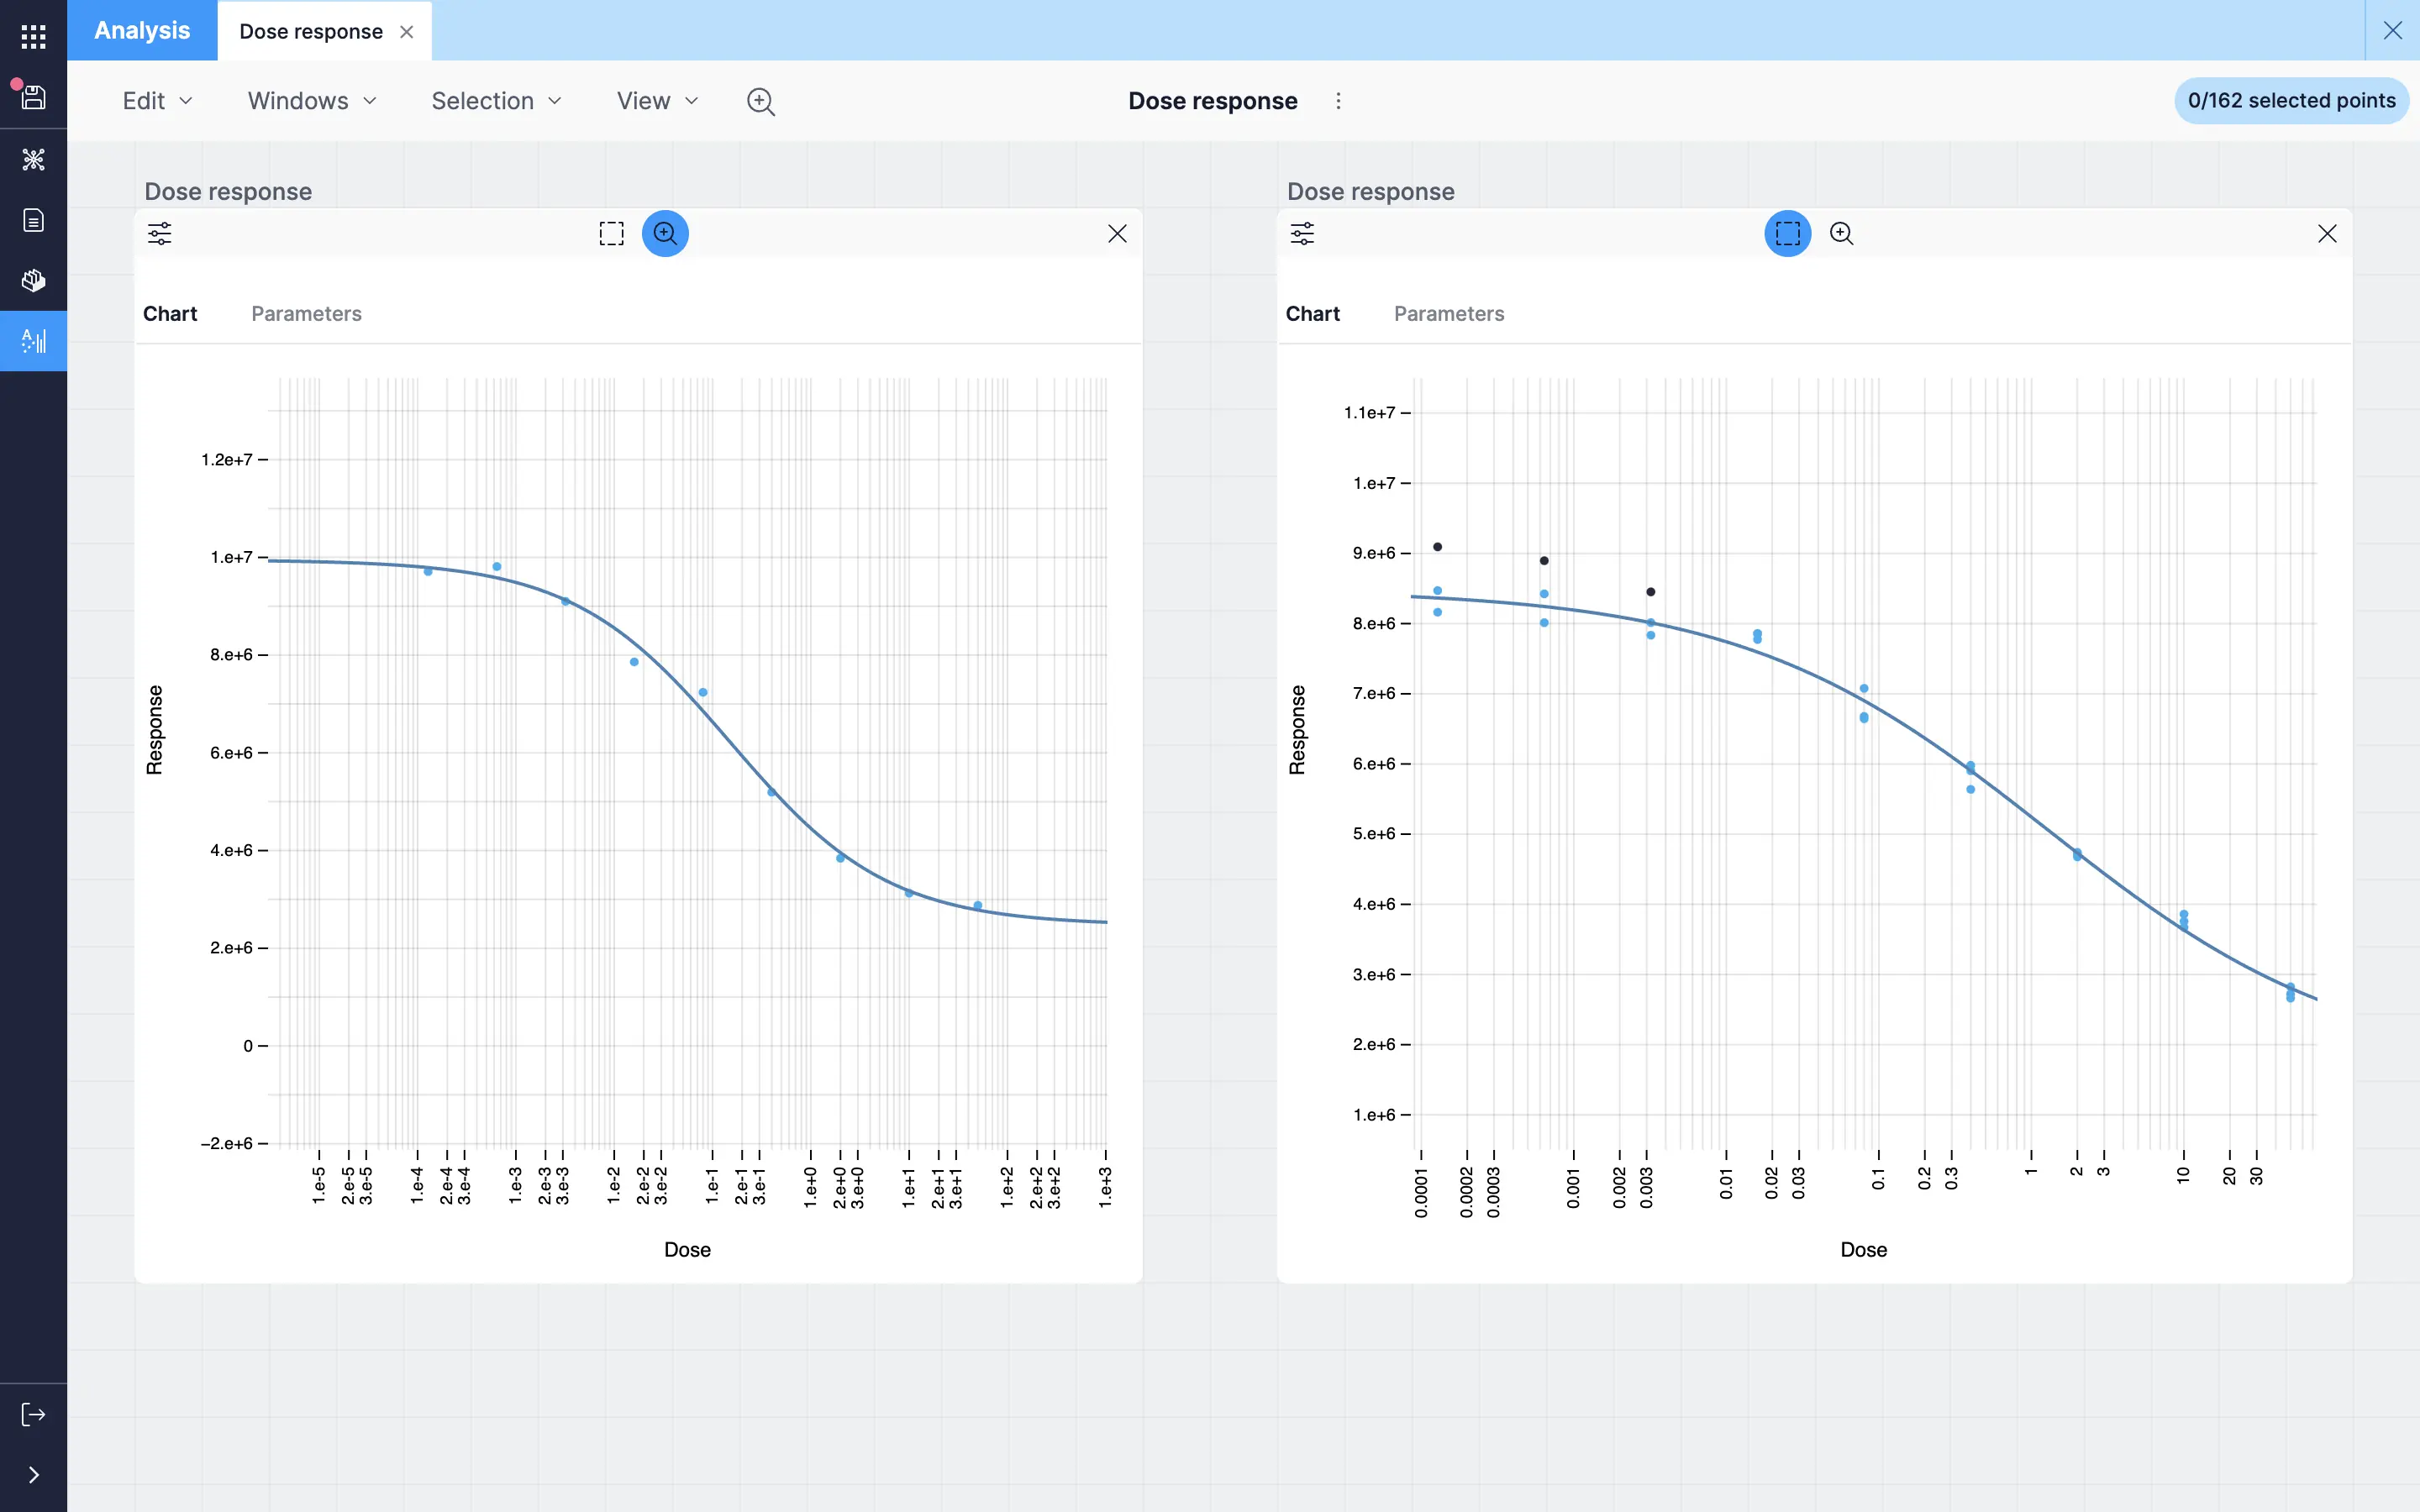
Dose response curves in the analysis manager. The application can fit does response curves and find
relative and absolute IC and EC values. The black points in the second curve are outliers and are not
included in the fit.