
Pharmacokinetics of an ADC series
Hand the assistant a PK study and get back the non-compartmental parameters for every animal, the curves overlaid, and the comparison that matters for a conjugate: how fast it clears, and how fast it loses its payload.
Start with the study table
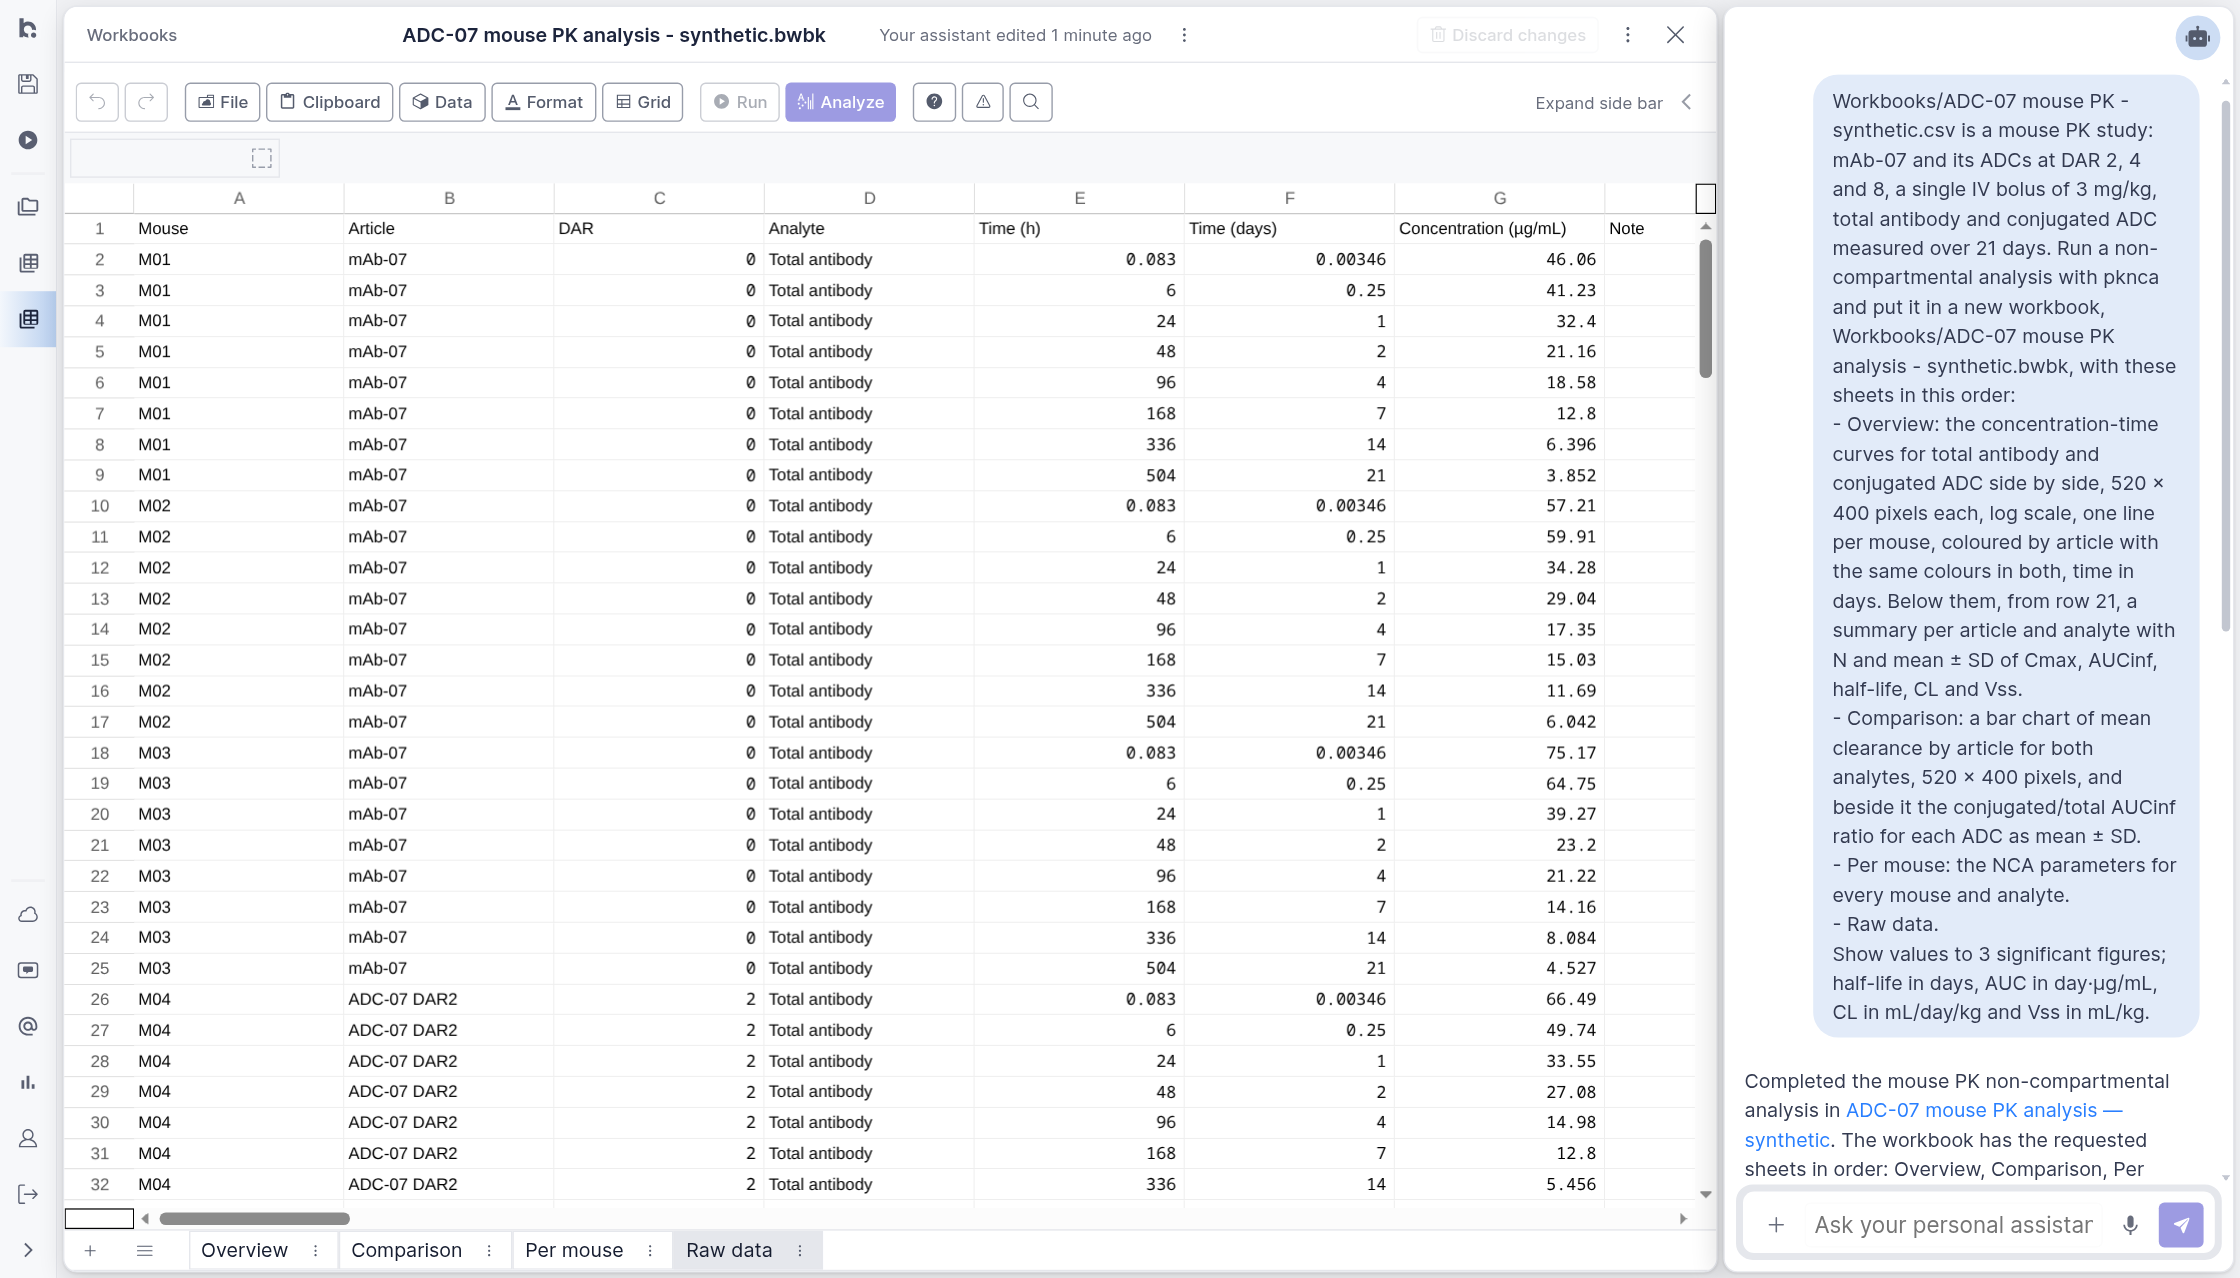
A PK study arrives as one long table: a row per mouse, analyte and time point. In this synthetic example an antibody, mAb-07, and three conjugates of it at drug-to-antibody ratios (DAR) of 2, 4 and 8 are each given to three mice as a single 3 mg/kg intravenous bolus. Total antibody and conjugated ADC are measured in plasma from 5 minutes to 21 days, 168 samples in all. Three samples on day 21 fall below the 0.05 µg/mL quantification limit and are marked as such rather than entered as zero. The request names the study design, the parameters and the layout wanted; the assistant does the rest.
Run the analysis
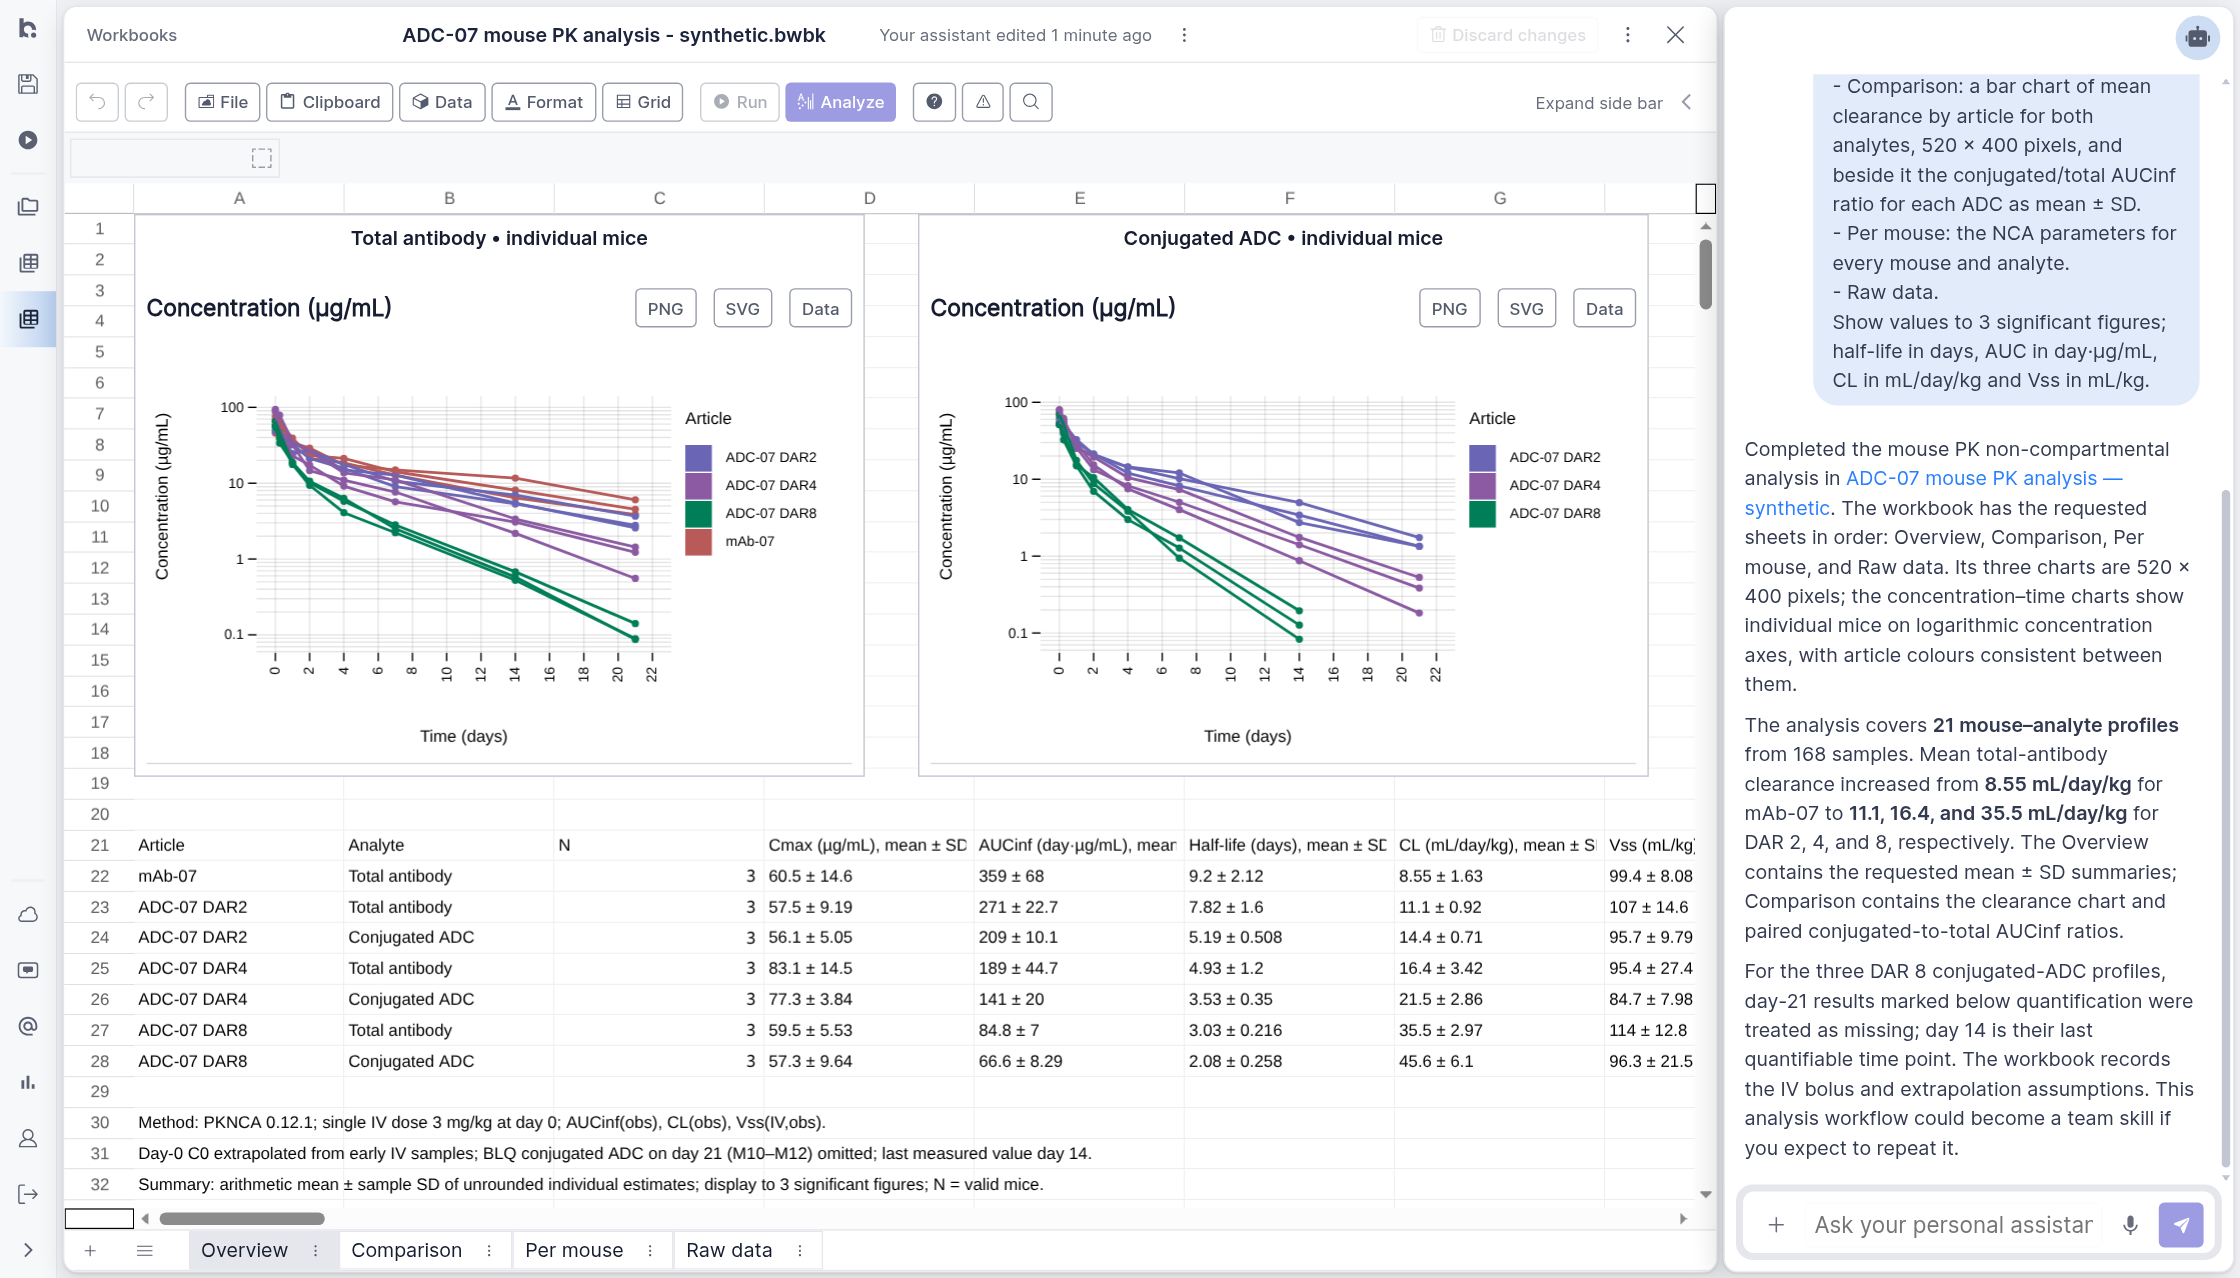
The assistant runs a non-compartmental analysis with PKNCA, the open-source R package for NCA, as a job on the platform. Each mouse and analyte is its own profile, 21 in all. Because the dose was an intravenous bolus and the first sample comes 5 minutes after it, the concentration at the time of dosing is back-extrapolated from the first samples, and AUC, clearance and volume of distribution follow from it.
The overview draws every mouse as its own curve on a log scale, coloured by article, for total antibody and conjugated ADC side by side. The summary below gives N and mean ± SD of Cmax, AUC, half-life, clearance and volume per article and analyte, and the method notes record the dosing assumption and how the below-limit samples were treated.
Compare the conjugates
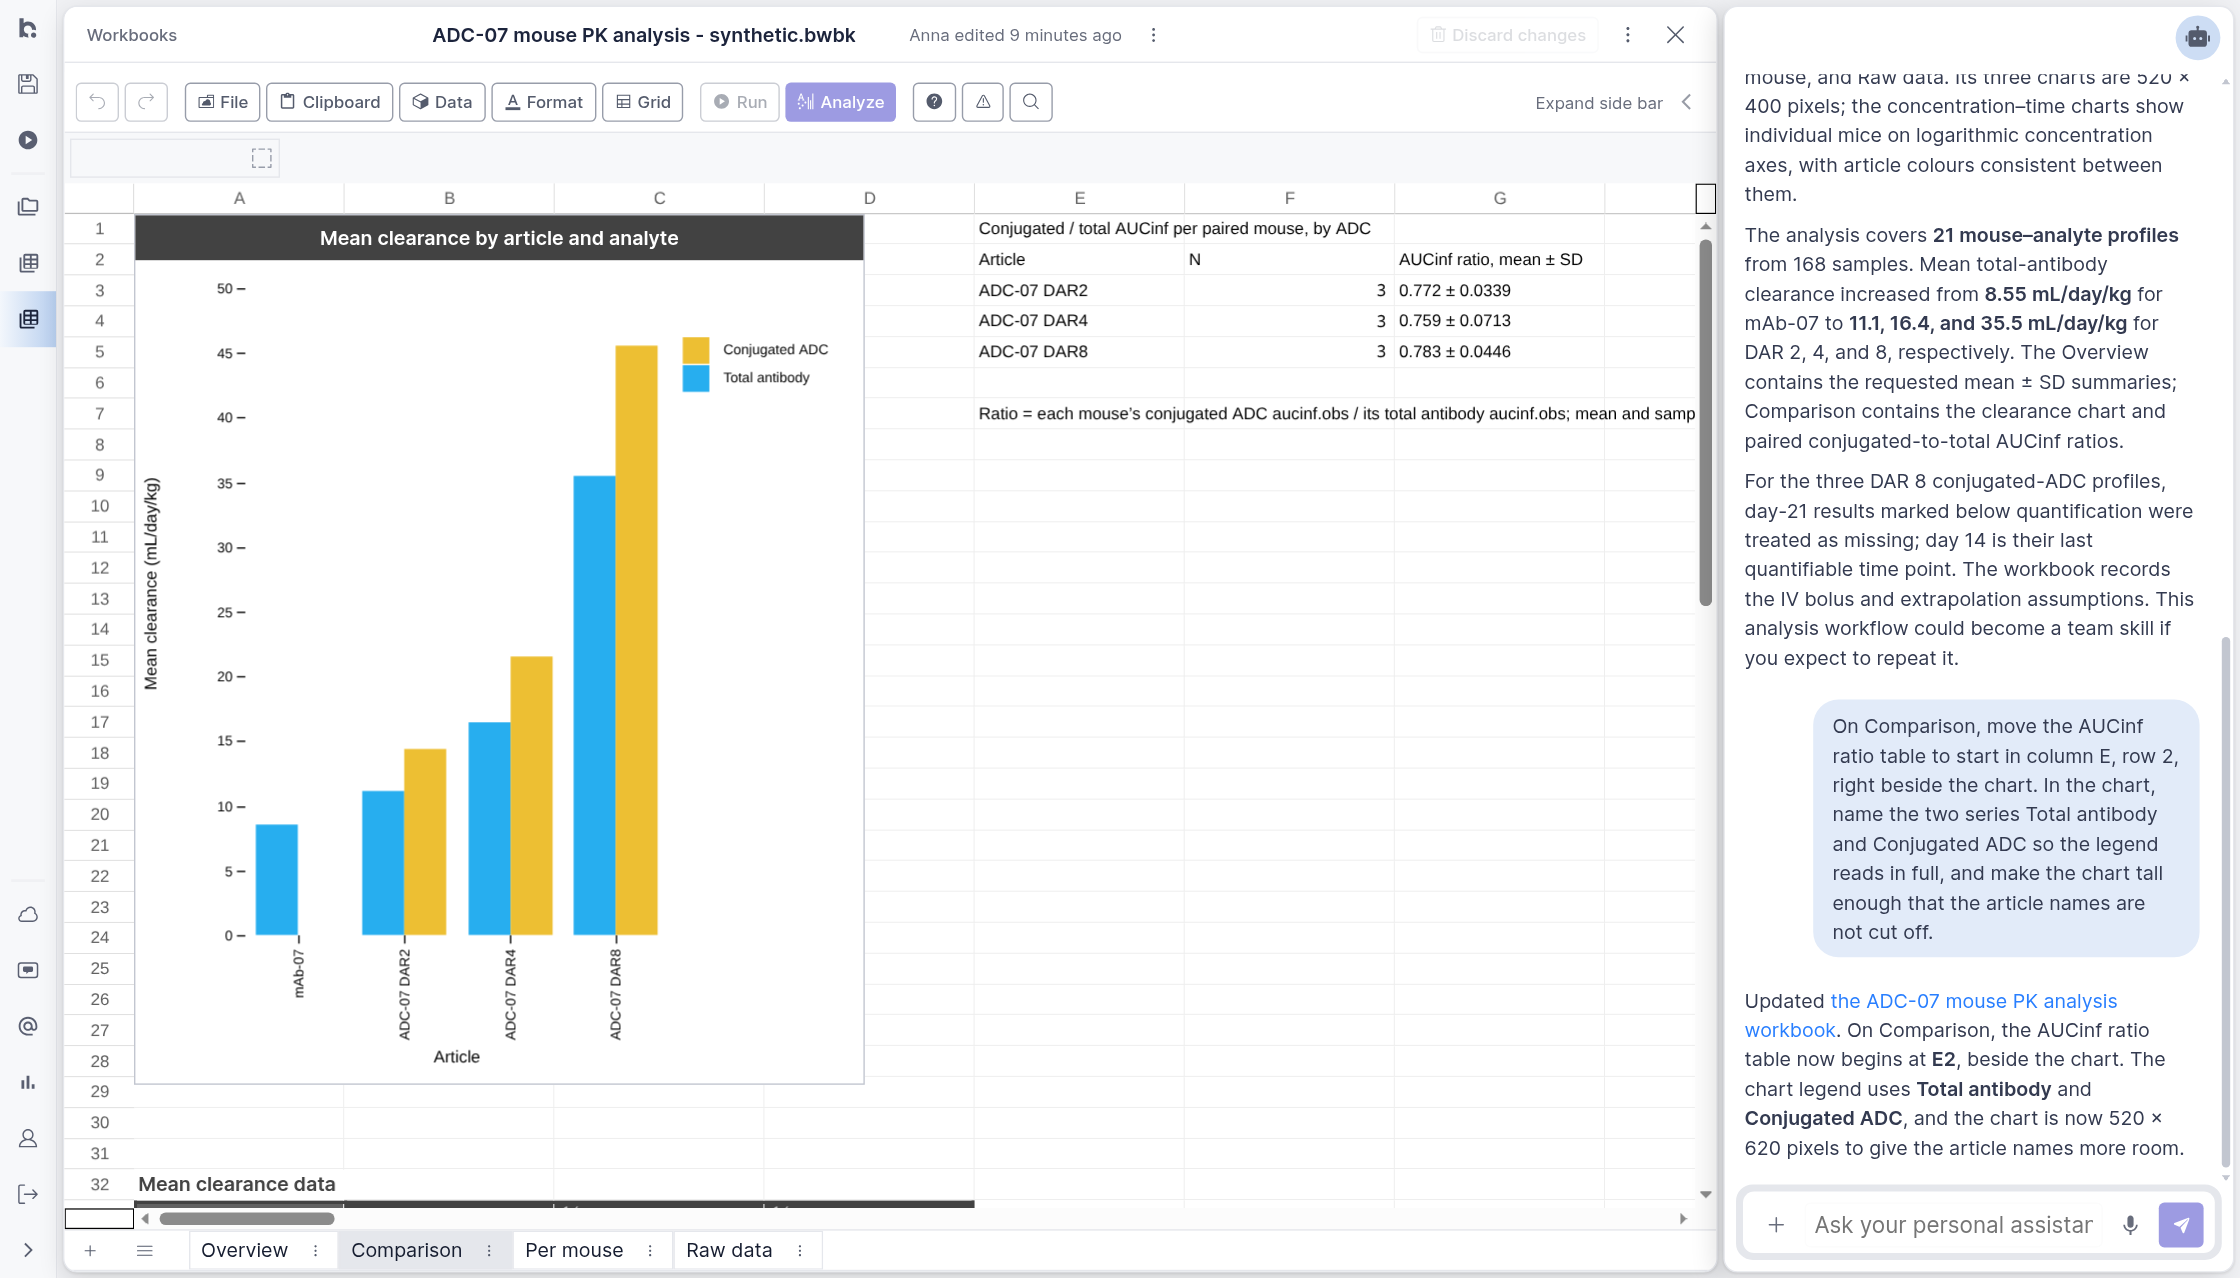
Clearance rises with drug load: from 8.55 mL/day/kg for the naked antibody to 11.1, 16.4 and 35.5 mL/day/kg at DAR 2, 4 and 8, and the half-life falls from 9.2 to 3.0 days. Conjugated ADC clears faster than total antibody at every DAR, and its exposure is about three quarters of total-antibody exposure: the rest is antibody that has lost its payload in circulation. Each ratio is taken per mouse, from the two analytes measured in the same animal, before it is averaged.
Customize the analysis
The dosing route, the NCA parameters, sparse sampling for studies where each animal is bled once, and the units all go into the request, and the analysis input and PKNCA output are saved beside the workbook. A team that runs the same study design again can keep the request as a skill, so the next study comes back in the same layout.