
A PK model of an ADC series
Fit a compartmental model to a PK study and predict how a conjugate loses its payload, and what a repeated dosing schedule would leave in circulation.
Fit a model to the study
The study is the synthetic one from the non-compartmental analysis: an antibody, mAb-07, and three conjugates of it at drug-to-antibody ratios of 2, 4 and 8, each given to three mice as a single 3 mg/kg intravenous bolus, with total antibody and conjugated ADC measured over 21 days. The assistant fits the models with pk-model, which runs nlmixr2, the open-source population PK package, as a job on the platform.
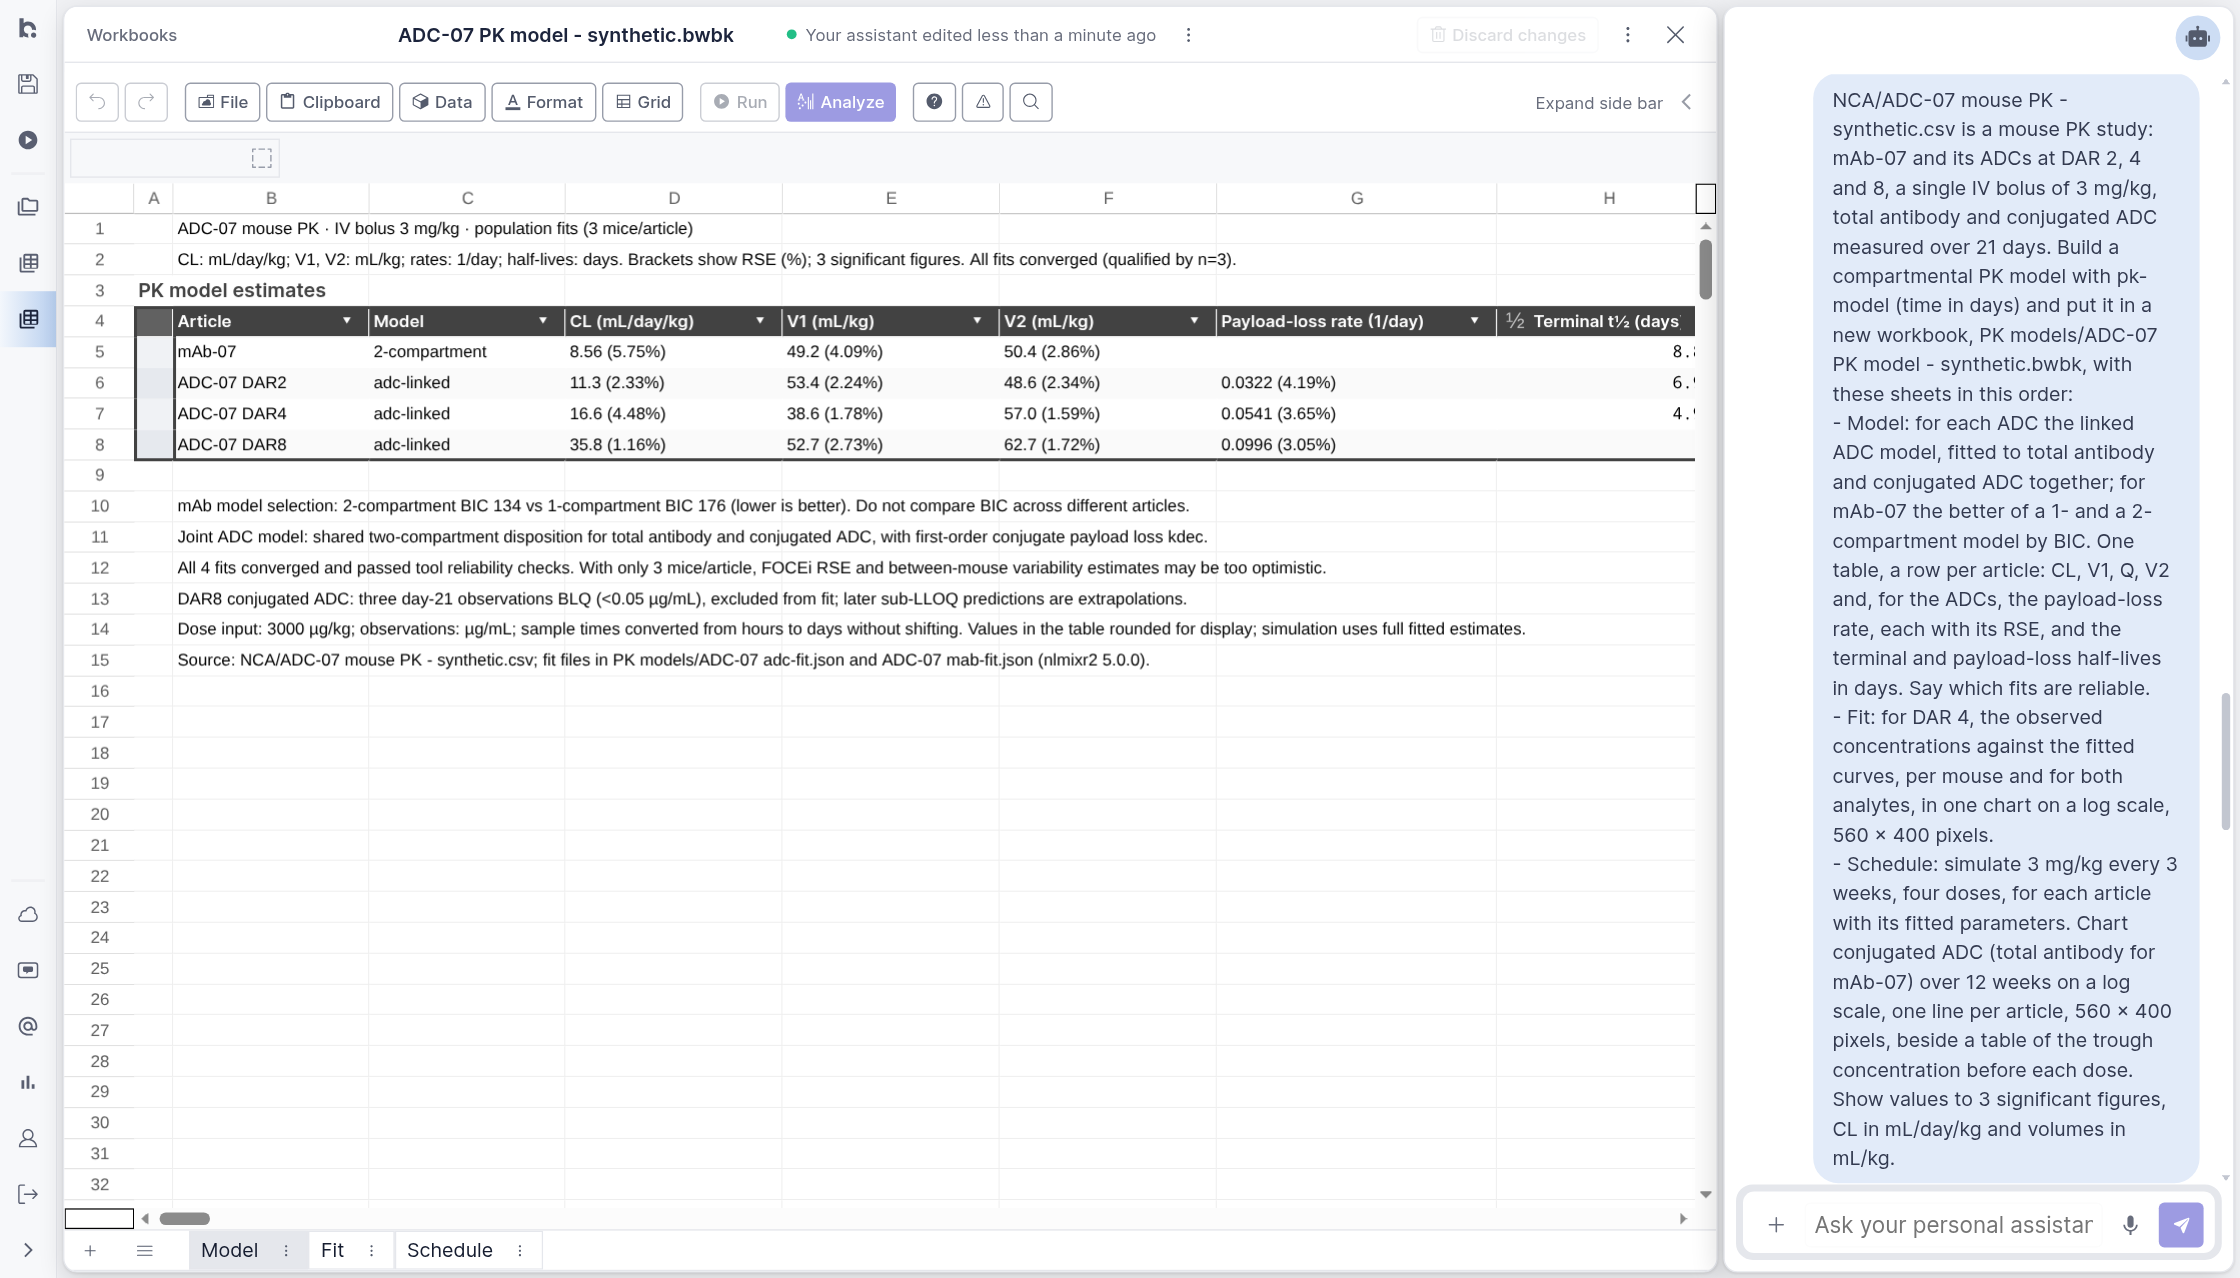
For the antibody it compares a one- and a two-compartment model and keeps the two-compartment one, with the lower BIC (134 against 176). Each conjugate gets a linked model fitted to both analytes at once: one two-compartment disposition, and a conjugate that loses its payload at a fitted rate. The table gives each estimate with its relative standard error. Clearance rises from 8.56 mL/day/kg for the antibody to 11.3, 16.6 and 35.8 mL/day/kg at DAR 2, 4 and 8, and the payload-loss rate from 0.032 to 0.054 and 0.100 per day: a half-life of the payload on the antibody of 21.5, 12.8 and 7.0 days. The notes record what the fits rest on, three mice an article, and that their standard errors are likely too small for it.
Check the fit
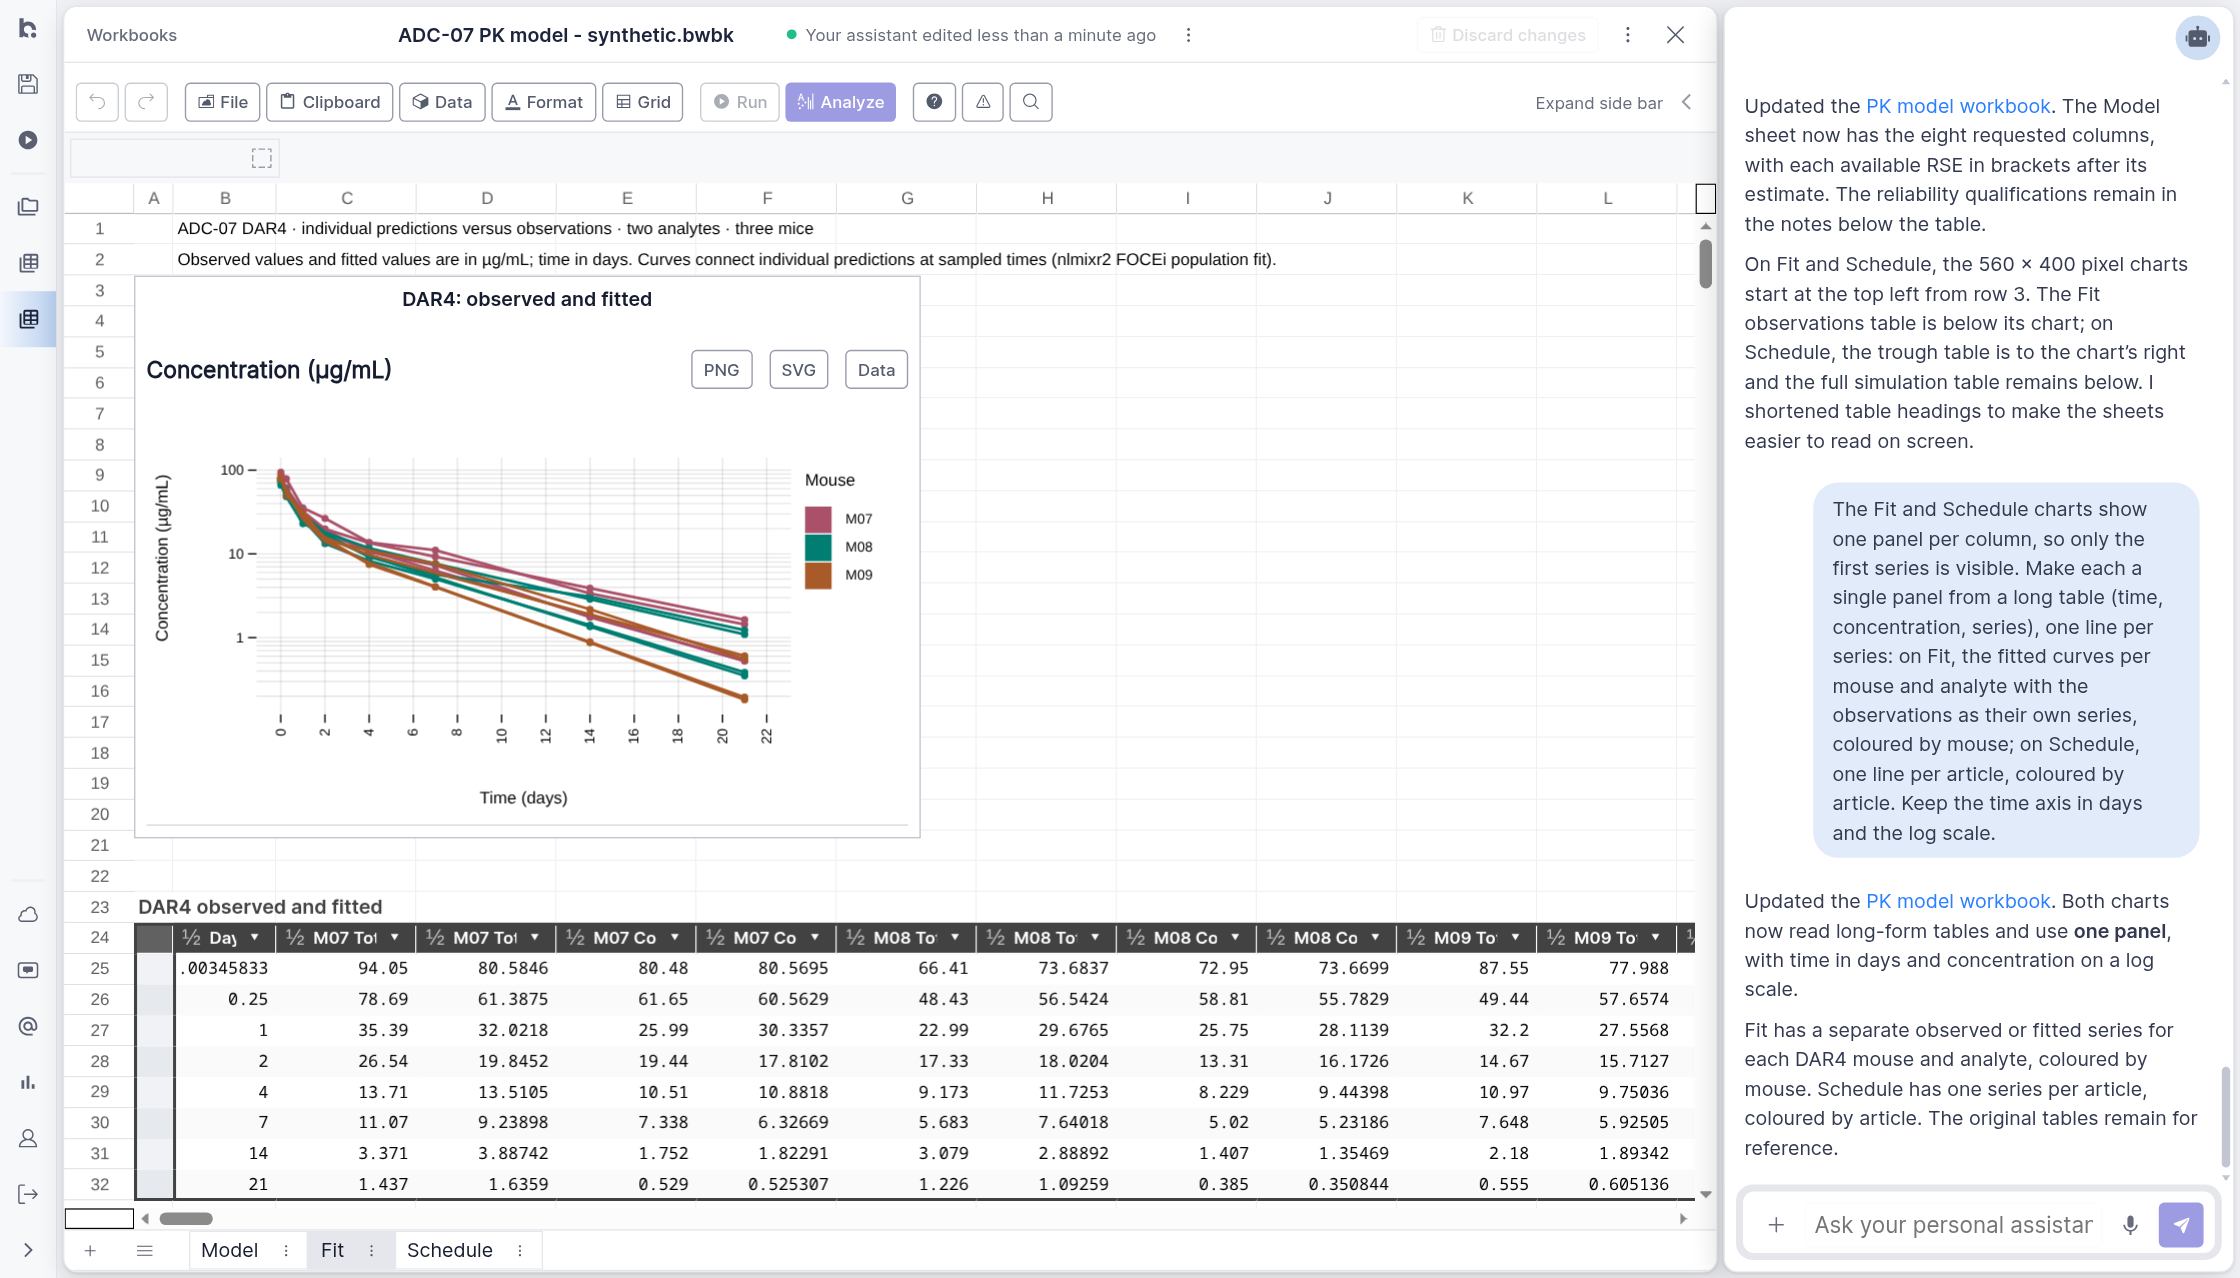
A model is only as good as its fit to the animals it came from. For the DAR 4 conjugate, each mouse's measured concentrations and the model's curve for that mouse are drawn together, for total antibody and conjugated ADC, so a systematic miss shows as two lines drifting apart. Here the fitted curves stay close to each mouse's measurements over the 21 days, for both analytes.
Simulate a schedule
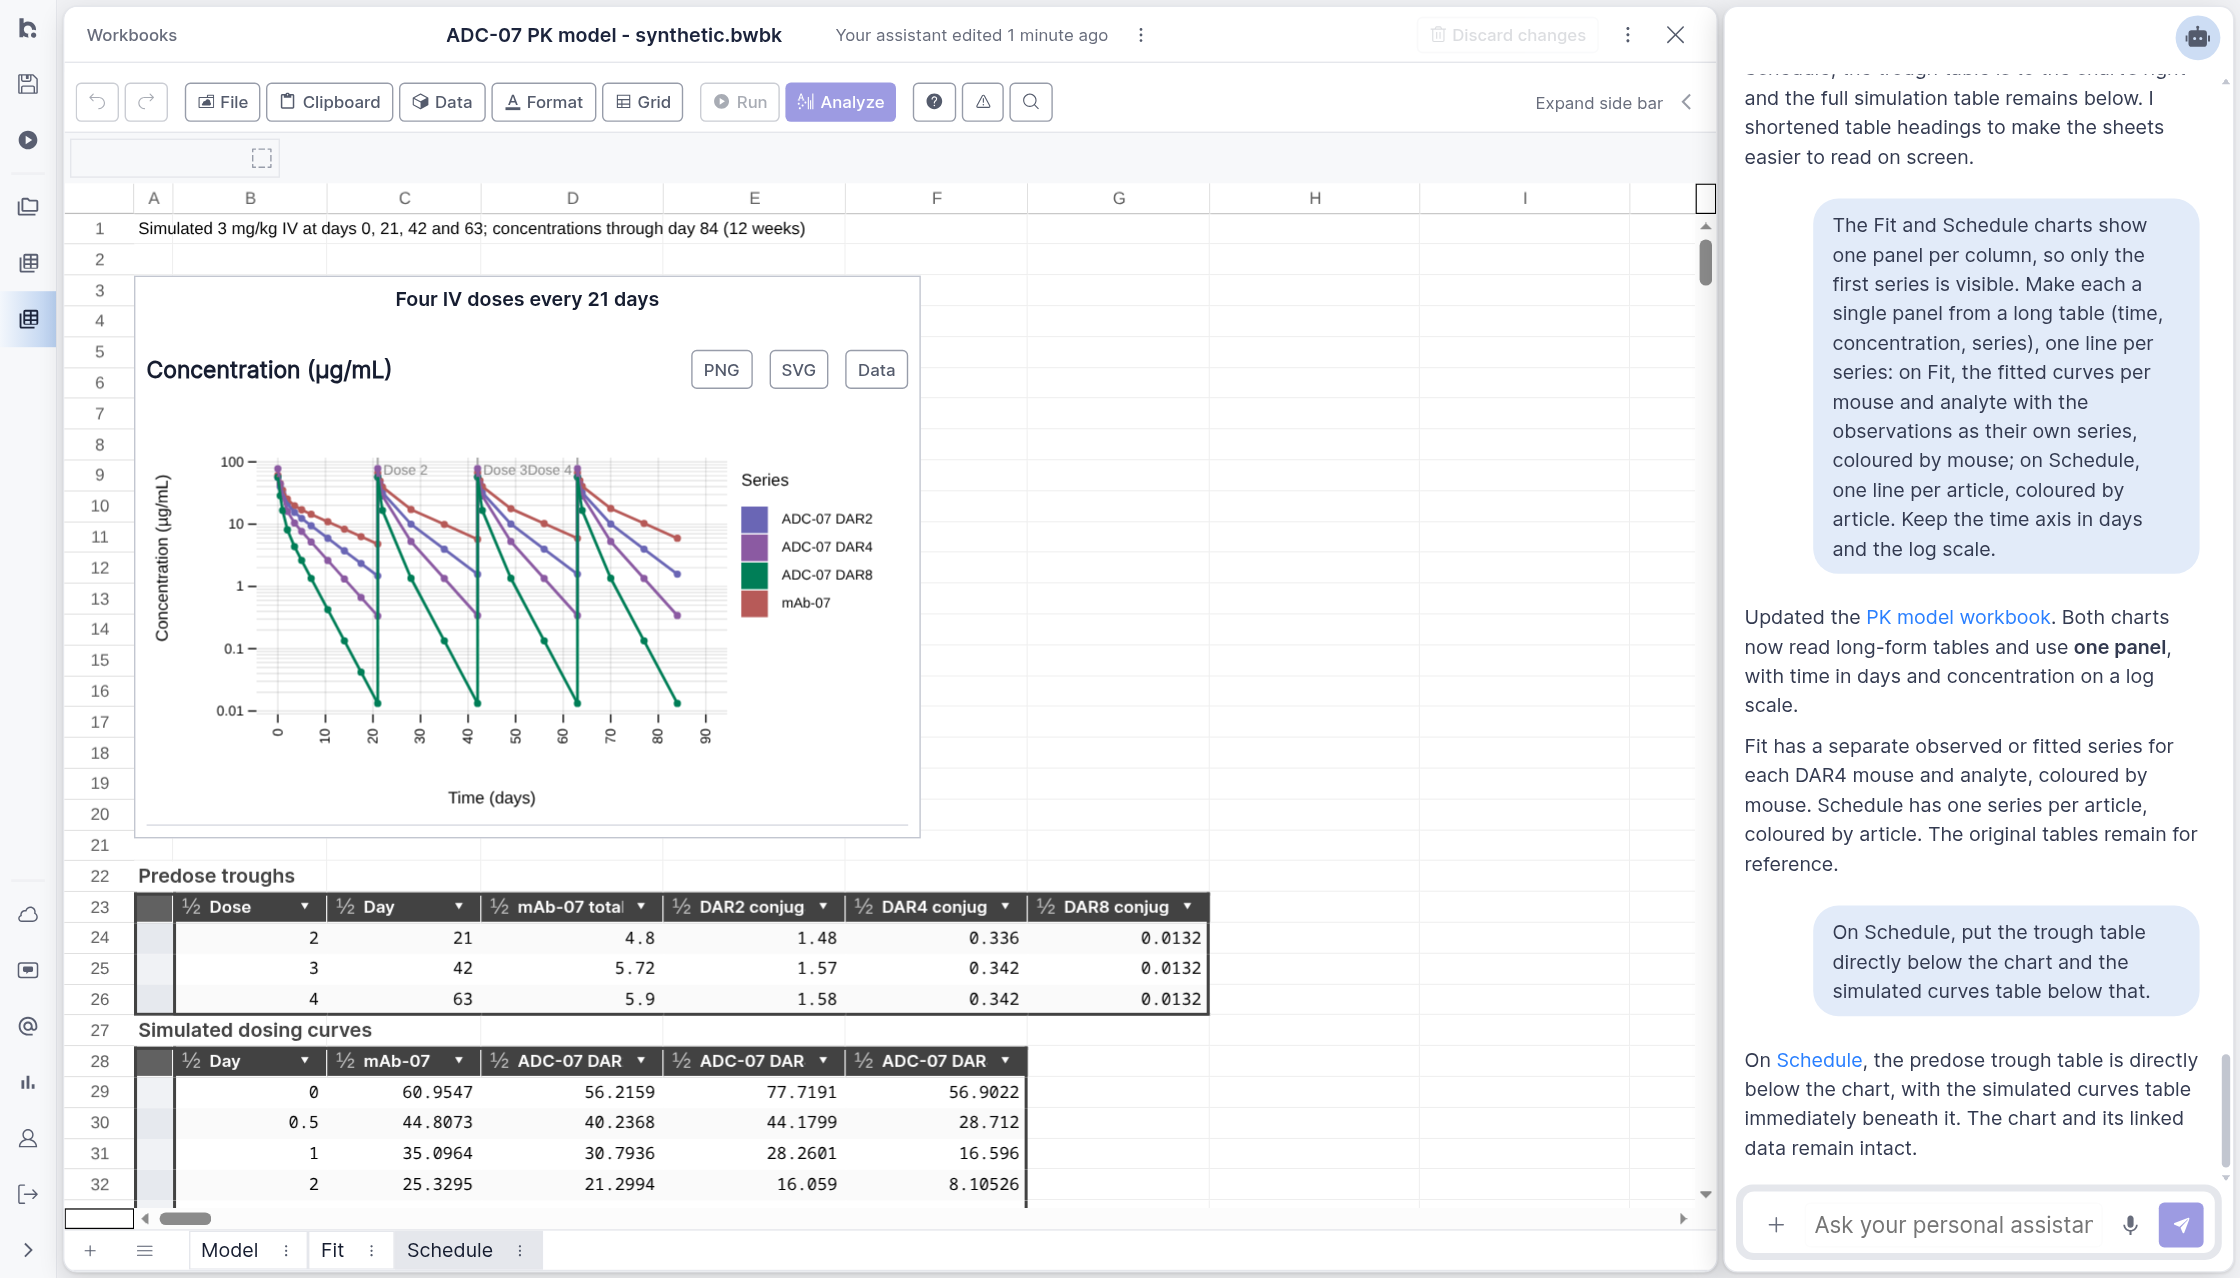
With the fitted parameters, the model predicts a study nobody has run yet: 3 mg/kg every three weeks, four doses. The antibody accumulates a little, from a trough of 4.8 to 5.9 µg/mL. The DAR 2 conjugate keeps about 1.5 µg/mL of conjugated ADC before each dose, DAR 4 about 0.34 µg/mL, and DAR 8 about 0.013 µg/mL: at the highest drug load almost no conjugate is left by the next dose. That last value lies below the assay's 0.05 µg/mL quantification limit, and the workbook says so, as an extrapolation rather than a measurement.
Customize the analysis
The models to compare, population, individual or pooled fits, infusion or extravascular dosing, saturable elimination, starting and fixed values, and the regimen to simulate all go into the request. A fit that does not converge or leaves a parameter undetermined is reported with its reasons rather than as a result, and the fitted parameters are saved beside the workbook for the next simulation.